Silver is trading around $65.37 on the 5-hour chart, trapped between $63.00 and $66.25 as buyers and sellers struggle to establish control. The price is sitting near the middle of the range, while moving averages and the Ichimoku cloud are creating conflicting signals. Recent market data show silver recovering from a sharp September decline, but the metal remains sensitive to U.S. interest-rate expectations, Treasury yields and the dollar ahead of the Federal Reserve’s policy decision.
Silver Remains Trapped in Range
The immediate technical structure is defined by a narrow consolidation zone. At $65.37, silver is positioned close to the Ichimoku cloud, which spans approximately $65.04 to $65.87 in the supplied chart setup. The cloud reflects an area where trend signals are less decisive, making a sustained move outside it more important for short-term direction.
The longer-term structure retains some support because silver remains above the 200-period SMA near $64.17. However, the 50-period SMA around $65.81 is acting as a nearby barrier. The gap between these two averages highlights the market’s compressed price structure.
The broader market backdrop remains mixed. Reuters reported that spot silver gained 1.5% to $64.59 on Wednesday as precious metals recovered ahead of the Federal Reserve decision. Meanwhile, stronger U.S. yields and expectations for tighter monetary policy remain potential headwinds for non-yielding metals.
- Current price: Around $65.37
- Range support: $63.00
- Range resistance: $66.25
- 200-period SMA: $64.17
- 50-period SMA: $65.81
Key Levels Define Breakout Risk
Silver needs to clear the $65.81-$66.25 resistance band to establish stronger upside momentum. The 50 SMA and SuperTrend resistance are clustered in this area, making a sustained move above $66.25 more significant than a brief intraday spike.
A confirmed close above $66.40 would provide additional evidence that buyers have regained control. Such a move could shift attention toward higher resistance levels after silver recently experienced substantial volatility.
On the downside, $64.00 is the first important warning level, while the broader range floor sits around $63.00. A decisive break below $63.00 would invalidate the current consolidation structure and expose silver to a deeper correction.
Current price history shows how quickly the metal can move between these levels. Silver closed at $63.67 on September 15 after trading as low as $62.55 during the session, while the September 11 high reached $65.36.
Fed Decision Could Trigger Breakout
The Federal Reserve’s September policy decision is a major near-term catalyst for silver. Higher interest rates and Treasury yields generally increase the opportunity cost of holding non-yielding metals, while a softer rate outlook can improve their relative appeal.
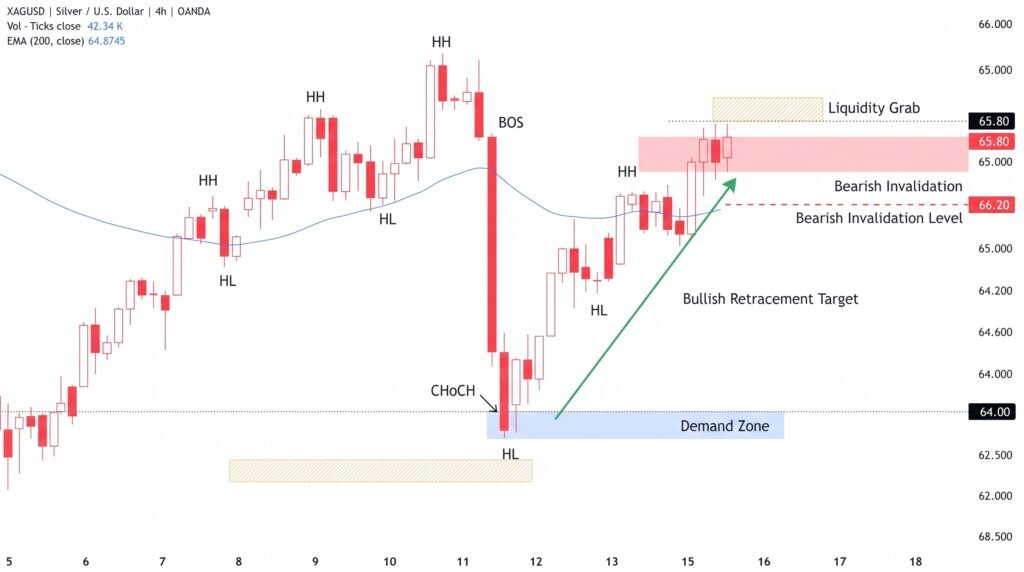
The technical indicators are therefore entering a potentially important test. Declining volume during consolidation would indicate reduced conviction, but a breakout accompanied by stronger volume would provide more evidence that the move has participation behind it.
The current setup leaves two clearly defined scenarios. A sustained move above $66.25-$66.40 would strengthen the bullish structure, while a break below $64.00 would increase downside pressure and put $63.00 back into focus.
Conclusion:
Silver remains caught between major technical levels, with $65.81-$66.25 limiting the upside and $64.00-$63.00 providing the key downside zones. The market’s next decisive move will likely depend on whether price can escape this range with stronger momentum. Until then, the $63-$66.25 area remains the central technical framework for XAG/USD.
Sources & Methodology
Primary-source standard: Market-moving facts should link to original data releases, regulator notices, company filings or official project announcements whenever available. Secondary reporting is used for additional context, not as a substitute for original evidence.
Page last reviewed: