Silver is testing the $67.94 Fibonacci resistance zone after a sharp rebound from the $62.75 area. The supplied five-hour setup shows silver at about $67.43, while live XAG/USD prices were around $67.02, up about 2.8% on September 18. The recovery has improved short-term momentum, but the market is approaching a level where a failed breakout could trigger another round of profit-taking.
The rebound follows a volatile week in which silver dropped below $63 after the Federal Reserve raised rates, before recovering as oil prices and Treasury yields eased. Reuters reported silver gained 4.2% on Thursday to about $65.60, while current futures prices have moved above $67.
$67.94 Tests the Silver Rally
The $67.94 level is the key technical hurdle in the supplied five-hour chart. It represents the 61.8% Fibonacci retracement highlighted in the setup and sits close enough to current prices to make the next few candles important for direction.
The chart shows a completed double bottom near $62.75, followed by a strong recovery. A Morning Star pattern from September 16 also supports the view that buyers regained control after the latest selloff. Price is above the major short-term moving averages and the Ichimoku Cloud in the supplied setup, reinforcing the improving near-term structure.
Momentum, however, is not uniformly strong. The ADX at 19.52 points to a relatively weak trend, while the RSI near 64.6 shows firm buying momentum without yet reaching the traditional 70 overbought threshold.
The main technical levels are:
- Resistance: $67.94
- Breakout zone: $69.60
- Next upside level: $71.16
- Pullback support: $66.00 and $64.50
A sustained close above $67.94 would provide stronger confirmation that the rebound is extending rather than merely correcting the earlier decline.
Fed Shift Changes the Macro Backdrop
The Federal Reserve is no longer an upcoming catalyst; it already raised the federal-funds target range by 25 basis points to 3.75%–4.00% on September 16 in a unanimous 12-0 decision. The Fed’s latest projections put the median year-end policy rate at 4.1%, indicating that officials still see a higher rate level as appropriate by the end of 2026.
That backdrop initially pressured silver because higher interest rates and Treasury yields can reduce the relative appeal of a non-yielding metal. But the relationship has eased over the past two sessions as energy prices and bond yields declined.
Brent crude fell to roughly $102.68 on Friday, while WTI slipped to about $100.08, as Saudi Arabia began restoring pipeline capacity and markets became less concerned about prolonged supply disruptions.
The U.S. 10-year Treasury yield was around 4.95% on Friday, below the recent 5% threshold. Meanwhile, the US Dollar Index was near 100.1 in the latest Investing.com snapshot.
Breakout or Bull Trap Near $68?
The immediate test is whether silver can sustain trade above $67.94 rather than simply probe the level and retreat. A decisive five-hour close above resistance, preferably accompanied by stronger volume, would improve the bullish structure and put $69.60 and $71.16 into focus.
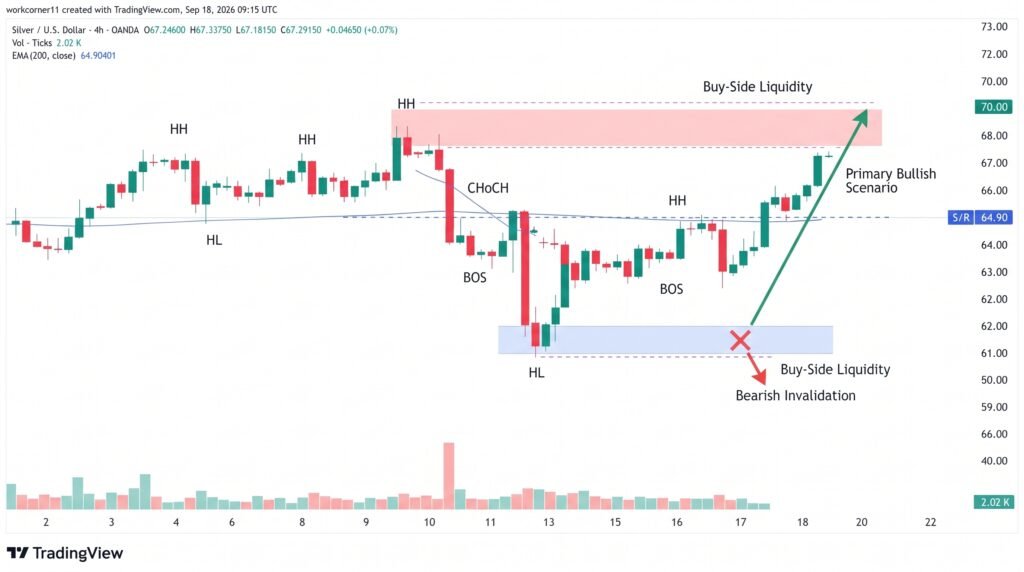
Failure at $67.94 would leave the market vulnerable to profit-taking. A retreat toward $66.00 would represent an initial test of the rebound, while deeper weakness could bring the $64.50 200-period moving average into focus in the supplied setup
The combination of rising RSI and relatively low ADX makes the breakout particularly important. A strong price move without stronger trend confirmation could produce another false breakout, while improving volume and sustained closes above resistance would provide more evidence that buyers are establishing control.
Conclusion
Silver has recovered sharply from $62.75, but $67.94 now stands between the rebound and a more durable technical breakout. The double bottom and improving momentum favor buyers, while an ADX near 19.5 warns that trend strength remains limited. The Fed’s latest rate increase continues to constrain precious metals, but falling oil prices and softer Treasury yields have recently reduced that pressure. A confirmed move above $67.94 would put $69.60 and $71.16 in focus; rejection would keep $66.00 and $64.50 as the main downside reference points.
Sources & Methodology
Primary-source standard: Market-moving facts should link to original data releases, regulator notices, company filings or official project announcements whenever available. Secondary reporting is used for additional context, not as a substitute for original evidence.
Page last reviewed: