
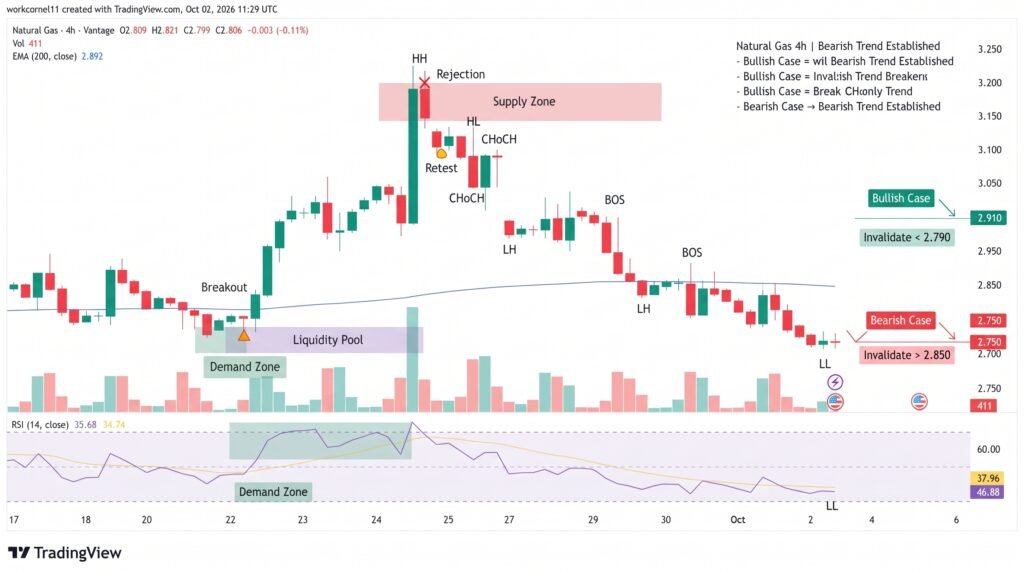
Natural Gas is testing a critical technical area around $2.914 on the five-hour chart, with sellers pressing toward the $2.880 region. The level is important because it coincides with the chart’s 200-period simple moving average and the stated 61.8% Fibonacci retracement zone. A sustained break could deepen the recent decline, while a successful defense could trigger a short-term recovery. Broader fundamentals remain relevant as well: the EIA expects US working natural-gas inventories to enter the winter season relatively high, potentially limiting upside pressure.
Natural Gas Tests Key Support
The five-hour chart shows natural gas recovering from recent lows before reversing sharply from higher levels. Price has now moved toward the $2.880-$2.900 region, where the 200-period SMA and Fibonacci retracement create a concentrated support area.
At $2.914, the market is only modestly above that zone. The technical structure remains vulnerable because price is below the major moving-average levels used by traders to identify the prevailing trend. Independent technical data also showed natural gas trading around $2.92 on October 2, with the broader indicator setup remaining bearish.
The key levels are tightly defined:
- Immediate support: $2.880
- Current price: $2.914
- Resistance: $3.030-$3.060
- Lower targets: $2.790 and $2.616
A five-hour close below $2.880 would weaken the support structure and place lower levels on the chart in focus.
RSI Nears Oversold Territory
Momentum indicators are also highlighting the pressure on buyers. The Relative Strength Index is around 32.93 in the supplied chart, approaching the traditional 30 oversold threshold. That signals strong recent selling but does not, by itself, establish that a durable rebound is due.
The MACD remains negative, with the supplied reading at -0.0315 against a -0.0144 signal line. That keeps downside momentum in place. The market is also trading below the $3.028-$3.067 Ichimoku Cloud zone, reinforcing the bearish technical structure.
Recent independent technical readings similarly showed RSI around 33 and MACD below zero, while the 200-period moving average remained considerably above the market.
$2.880 Break Could Shift Structure
A close below $2.880 would put $2.790 on the immediate downside map, followed by the deeper $2.616 area from the supplied chart structure. Conversely, holding $2.880 could allow natural gas to attempt a rebound toward $3.030-$3.060.
Fundamentals provide an additional backdrop. The EIA’s September outlook projected working gas inventories of 3,969 billion cubic feet by October 31, 2026, about 5% above the five-year average. The latest reported storage injection was 64 Bcf for the week ended September 25, taking inventories to about 3.42 trillion cubic feet, roughly 4% below the comparable year-earlier level.
That inventory picture means the technical breakdown is occurring against a market that still has substantial storage ahead of the winter withdrawal season.
Conclusion
Natural gas is approaching a decisive technical test at $2.880 after falling toward $2.914. The 200-SMA and 61.8% Fibonacci area give buyers a clear level to defend, while RSI near 33 shows that selling pressure is already strong. A confirmed five-hour close below $2.880 would expose $2.790 and potentially $2.616. If support holds, the first recovery test remains the $3.030-$3.060 resistance zone.
Sources & Methodology
Primary-source standard: Market-moving facts should link to original data releases, regulator notices, company filings or official project announcements whenever available. Secondary reporting is used for additional context, not as a substitute for original evidence.
Page last reviewed: