
The AUD/USD pair is recovering toward 0.6940 but remains under pressure as traders assess US employment data, Federal Reserve policy expectations and a softer Australian rate outlook. The Australian dollar has entered technically oversold territory, with the daily RSI near 28, raising the possibility of a short-term rebound. However, price remains below key moving-average and Bollinger Bands resistance. The immediate technical question is whether buyers can reclaim 0.7060 or whether sellers push the pair below 0.6905.
US Jobs Data Drives Dollar Outlook
The September US employment report is the next major catalyst for the currency pair. Economists expect US job growth to slow, while the unemployment rate is forecast to remain at 4.1%. A stronger-than-expected report could reinforce expectations for tighter Federal Reserve policy and support the US dollar.
Market expectations have shifted significantly. According to the CME FedWatch Tool, traders were pricing a substantially higher probability of the Fed keeping rates unchanged at its October meeting than a week earlier, while markets continued to anticipate additional policy tightening later in the year.
That shift leaves the US dollar sensitive to incoming economic data. Strong payrolls, wages or employment participation could revive expectations for higher rates, while weaker figures could reduce pressure on the Fed.
RBA Outlook Limits Aussie Support
The Australian dollar is also facing a less supportive domestic rate outlook. Recent Australian CPI data reinforced expectations that the Reserve Bank of Australia may have less urgency to raise rates at its November meeting.
Commerzbank analysts argued that expectations for roughly 1.5 additional RBA hikes had become excessive following the latest inflation data. They also pointed to weakness in the housing sector, including a 6.1% monthly decline in building approvals in August.
The key policy variables remain:
- RBA: Markets have reduced near-term hike expectations.
- Fed: US data remain central to future rate pricing.
- AUD/USD: Rate differentials remain a major currency driver.
Fed Governor Adriana Kugler’s recent policy remarks also kept attention on inflation and the need to maintain restrictive policy until price pressures move convincingly toward the Fed’s 2% objective.
AUD/USD Tests Oversold Support
The daily chart retains a bearish structure despite Friday’s rebound. AUD/USD is trading below its 100-day moving average and the middle Bollinger Band, leaving 0.6905 as the first major downside reference.
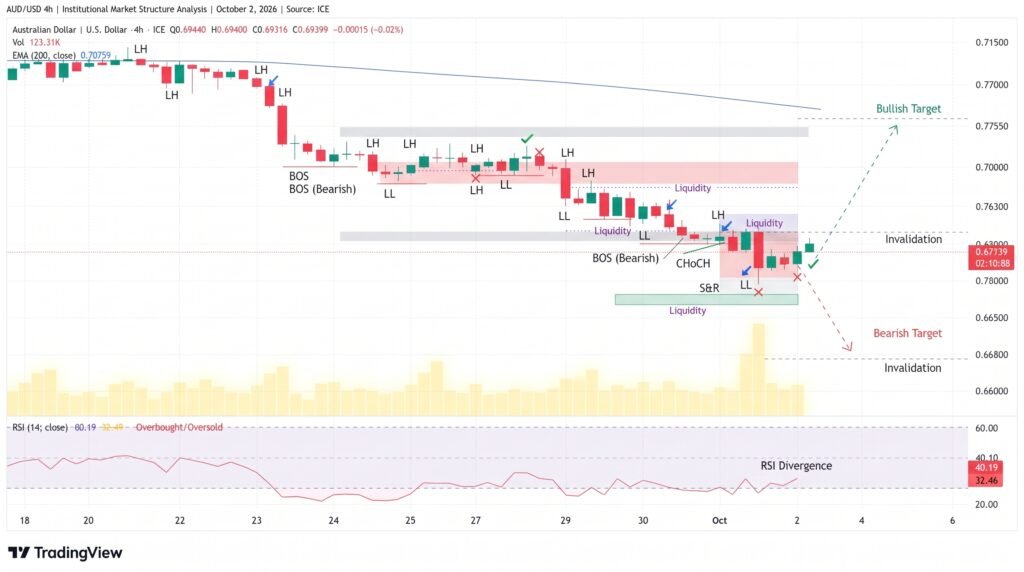
The Relative Strength Index near 28 indicates that the pair is technically oversold. That does not automatically signal a trend reversal, but it suggests selling momentum could slow if traders begin taking profits.
The technical levels are clearly defined:
- Immediate support: 0.6905
- First resistance: 0.7060
- Middle Bollinger Band: 0.7085
- Upper Bollinger Band: 0.7265
A sustained break below 0.6905 would expose the pair to further downside, while a recovery through 0.7060 would ease the immediate bearish pressure. A move beyond 0.7085 would provide stronger evidence that the rebound is extending.
Conclusion
AUD/USD is attempting to stabilize near 0.6940, but the broader technical structure remains bearish. RSI near 28 highlights oversold conditions, while the 100-day moving average at 0.7060 and Bollinger middle band at 0.7085 remain important recovery barriers. US employment data could determine whether dollar strength resumes, particularly if the figures alter Fed rate expectations. For the Australian dollar, softer RBA hike expectations add another constraint. The immediate technical boundaries are 0.6905 below and 0.7060 above.
Sources & Methodology
Primary-source standard: Market-moving facts should link to original data releases, regulator notices, company filings or official project announcements whenever available. Secondary reporting is used for additional context, not as a substitute for original evidence.
Page last reviewed: