
The US Dollar Index (DXY) eased for a second session on Wednesday but remained above 102.00 as investors awaited September’s US inflation report. The index had recently reached its highest level since April 2025, leaving the market vulnerable to profit-taking as Treasury yields retreated. Still, expectations for another Federal Reserve rate increase later this year and continued geopolitical uncertainty are helping limit dollar losses. On the technical chart provided, support between 101.65 and 101.70 is the key level that could determine whether the pullback remains temporary or develops into a deeper correction.
US CPI Puts DXY in Focus
The September Consumer Price Index (CPI) is the main near-term catalyst for the dollar. Economists surveyed by Reuters expected headline inflation to rise 0.6% month over month and 3.6% annually, compared with a 0.4% monthly increase in August. Core CPI, which excludes food and energy, was expected to increase 0.2%. Those estimates make the composition of the report particularly important: higher gasoline prices could lift headline inflation even if underlying price pressures remain more restrained.
A stronger-than-expected reading could revive expectations for tighter monetary policy and support the dollar by pushing Treasury yields higher. A softer report could have the opposite effect, especially if investors conclude that the Federal Reserve can leave interest rates unchanged at its October meeting.
Markets are also watching Thursday’s Producer Price Index (PPI) and remarks from Fed officials for additional evidence about the policy outlook. Boston Fed President Susan Collins said another rate increase remained possible before year-end, reinforcing the view that December could be more consequential than October.
Technical Levels Define the Outlook
The supplied five-hour technical analysis keeps the near-term bias positive while DXY holds above the 101.65–101.70 zone. The area previously acted as resistance and is now viewed as potential support. In technical analysis, a former ceiling can become a floor after a sustained breakout, although that role must be confirmed by subsequent price action.
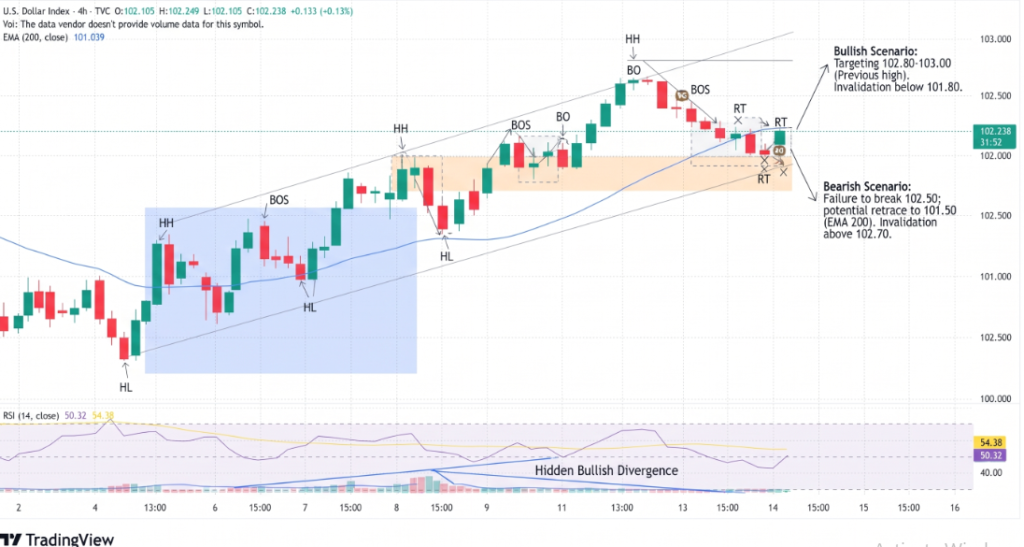
Momentum indicators also remain constructive. The Moving Average Convergence Divergence (MACD) reading is positive at 0.02, while the Relative Strength Index (RSI) stands at 64.81. The RSI is above its neutral midpoint of 50 but below the commonly used overbought threshold of 70. Together, the readings suggest that buying momentum persists, although it could weaken if the index continues to retreat.
Traders are monitoring three key signals:
- 102.00: The immediate psychological level the dollar is trying to defend.
- 101.65–101.70: The pivotal support zone for the current bullish structure.
- A daily close below 101.65: A warning that the pullback may be deepening.
Conclusion:
DXY remains technically supported, but the inflation report could quickly change market expectations. A sustained hold above 101.65–101.70 would keep buyers in control, while a decisive daily close below that band would strengthen the case for a deeper correction. Until the data and price action confirm the next move, traders have reason to avoid assuming that the dollar’s recent rally has either resumed or definitively ended.
Sources & Methodology
Primary-source standard: Market-moving facts should link to original data releases, regulator notices, company filings or official project announcements whenever available. Secondary reporting is used for additional context, not as a substitute for original evidence.
Page last reviewed: