
Cardano (ADA) traded above $0.2200 on Monday after losing approximately 12% over the previous week, as weakening derivatives activity and subdued large-investor accumulation reinforced its bearish outlook. Data from CoinGlass showed ADA futures open interest falling to $475.58 million from $549.14 million. Meanwhile, technical indicators pointed to further downside following a break below short-term trendline support. Traders are watching $0.1894 as a potential target, representing a decline of nearly 15% from the $0.2200 reference price.
Cardano Demand Weakens as Futures Cool
ADA has declined more than 10% in October, suggesting that speculative demand is weakening after the latest sell-off. Open interest measures the value of outstanding futures contracts that have not been settled or closed. Its decline can indicate traders are reducing exposure, although it does not independently establish whether the market will fall further.
The reported drop from $549.14 million to $475.58 million represents a reduction of approximately 13.4%. This contraction, alongside ADA’s falling price, suggests that leveraged participation is cooling rather than new positions supporting a recovery.
The funding rate remained positive at 0.0032%, indicating a modest cost paid by long-position holders to short-position holders under the relevant funding mechanism. Positive funding can reflect a preference for bullish positioning, but it does not guarantee that prices will rebound. If ADA continues declining, leveraged buyers could face forced liquidations.
According to Santiment, wallets holding more than 100 million ADA controlled 15.99% of circulating supply, up slightly from 15.95% a week earlier. Wallets holding between 10 million and 100 million ADA accounted for 38.11%, down from 38.27%.
These figures suggest limited changes in large-holder positioning, rather than strong evidence of aggressive accumulation. Combined with declining futures open interest, the data supports a cautious short-term outlook.
ADA Technical Analysis Signals More Risk
The technical structure remains bearish after ADA broke below a declining trendline near $0.2321 last week. The token is trading beneath its 50-day and 200-day Exponential Moving Averages (EMAs), positioned around $0.2290 and $0.2395, respectively. These averages can act as resistance when prices remain below them.
Momentum indicators also favor sellers. The Moving Average Convergence Divergence (MACD) remains below zero with a negative histogram, while the Relative Strength Index (RSI) sits near 42. The RSI reading signals weak momentum without indicating that ADA has reached conventional oversold territory.
Key levels traders are monitoring include:
- Initial resistance: $0.2290 at the 50-day EMA.
- Trendline resistance: $0.2321.
- Major resistance: $0.2395 at the 200-day EMA.
- Downside support: $0.1894, near the August 30 low.
Cardano Price Forecast: Is $0.19 Next?
A sustained move below $0.2200 would leave ADA exposed to further losses, with $0.1894 representing a potential downside objective. From $0.2200, that level implies a decline of approximately 13.9%, broadly consistent with the reported 15% downside scenario.
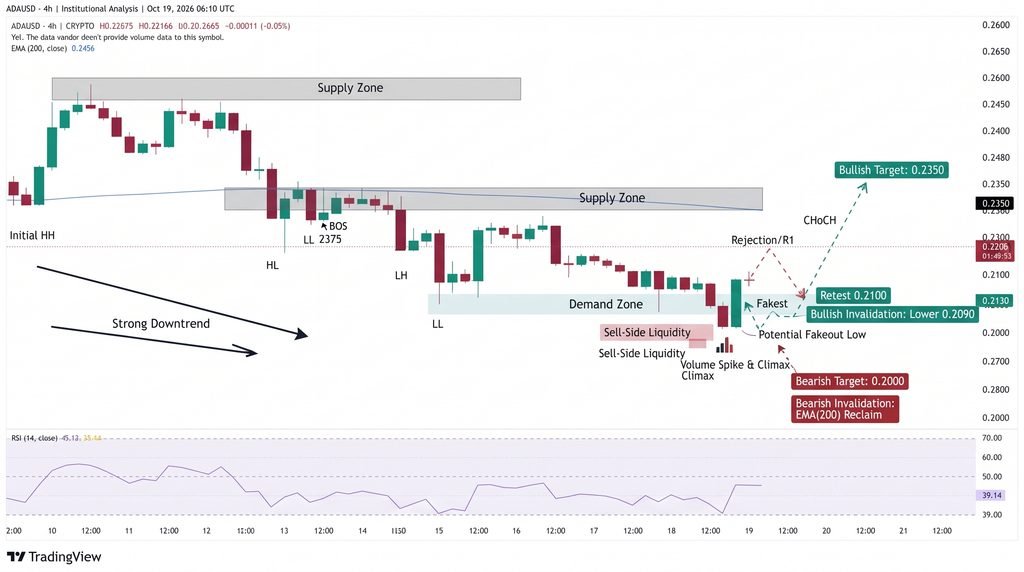
Conversely, a recovery above $0.2290 and $0.2321 would weaken the immediate bearish setup. Reclaiming $0.2395 would provide stronger evidence that buyers are regaining control.
Conclusion
Cardano faces continued downside risk as futures participation contracts and momentum indicators remain weak. The $0.1894 area is a key support target, but a sustained recovery above $0.2395 would challenge the bearish outlook. Traders should monitor price action, funding rates and open interest together rather than treating any single indicator as a definitive signal.
Sources & Methodology
Primary-source standard: Market-moving facts should link to original data releases, regulator notices, company filings or official project announcements whenever available. Secondary reporting is used for additional context, not as a substitute for original evidence.
Page last reviewed: