
Pi Network (PI) is trading near $0.0786 on Monday, with declining trading activity and weak technical momentum leaving the token vulnerable to another test of its historical low. Weekly spot volume has fallen to 30.36 million PI, according to the supplied figures, while futures open interest has declined to $8.08 million from $8.80 million on Friday. The price is holding above $0.0774 support, but a decisive break could expose the $0.0704 area.
PI Demand Weakens Across Markets
The latest figures point to reduced participation in Pi Network’s spot and derivatives markets. Weekly spot volume has declined for four consecutive weeks since reaching 65.52 million PI in late September. Lower volume can indicate waning interest, although it does not establish whether investors are selling, waiting for clearer direction or moving activity to other trading venues.
Futures open interest (OI) has also contracted, falling from $8.80 million on Friday to $8.08 million on Monday. OI measures the notional value of outstanding derivative contracts that have not been settled. A decline can reflect traders closing positions, liquidations or changes in market prices; it does not, by itself, prove that retail investors are leaving.
PI’s broader price performance reinforces the cautious outlook. Market participants are watching the Pi Network price closely as the token remains well below its previous highs and trades near the $0.0774 support area. Without a sustained recovery in price and trading activity, buyers may struggle to reverse the prevailing downtrend.
Pi Network Price Forecast: Key Levels
On the daily chart, PI remains below its 50-day exponential moving average (EMA) at $0.0865 and a descending trendline near $0.0843. These levels represent overhead resistance that the token would need to overcome to improve its short-term outlook.
The 23.6% Fibonacci retracement, calculated from $0.1394 to $0.0704, sits near $0.0866. Its proximity to the EMA creates a resistance zone around $0.0843–$0.0866. A sustained break above $0.0865 could open a recovery path toward the 50% retracement at $0.1049.
Momentum indicators remain weak. The Relative Strength Index (RSI) is at 37, below the neutral 50 mark but not yet at the conventional oversold threshold of 30. The MACD indicator also remains marginally below its signal line, indicating that bearish momentum has not clearly reversed.
- Immediate support: $0.0774, the October 8 low.
- Major downside level: $0.0704, the historical low cited in the chart.
- First resistance zone: $0.0843–$0.0866.
- Recovery target: $0.1049 if price clears the overhead barriers.
Can PI Avoid Another Record Low?
A daily close below $0.0774 would weaken the current support structure and increase the possibility of a retest near $0.0704. A break beneath that level would put PI into price territory with limited historical support, making volatility and downside risk harder to assess.
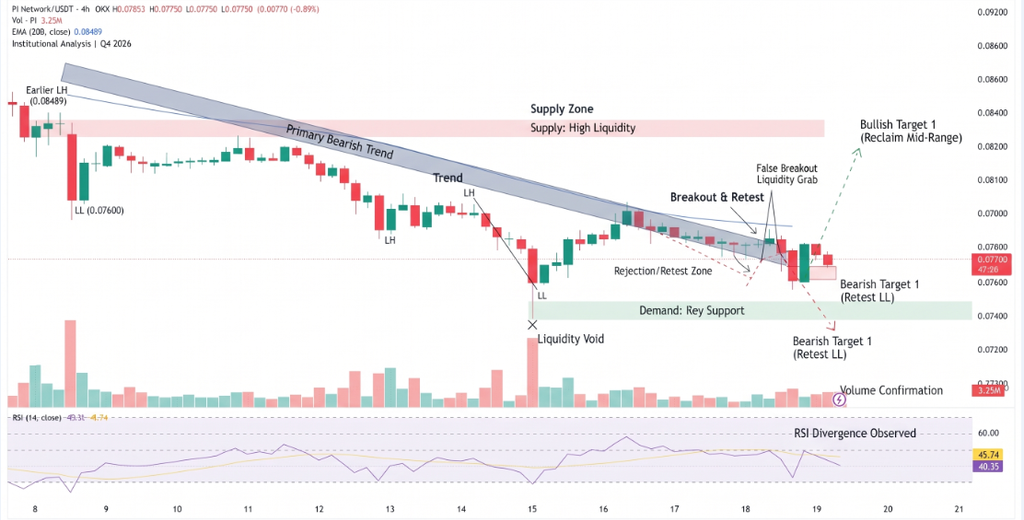
Conversely, a recovery above $0.0865, supported by stronger spot volume and stabilizing futures open interest, would provide an early signal that selling pressure is easing. Until then, technical evidence favors caution rather than assuming the latest consolidation marks a bottom.
Conclusion
Pi Network remains under pressure as spot activity and futures open interest decline. The $0.0774 level is the immediate line to watch, with $0.0704 the next major downside reference. A sustained move above $0.0865 would weaken the bearish outlook, but confirmation from price and trading activity remains essential.
Sources & Methodology
Primary-source standard: Market-moving facts should link to original data releases, regulator notices, company filings or official project announcements whenever available. Secondary reporting is used for additional context, not as a substitute for original evidence.
Page last reviewed: