
The US dollar strengthened against the Japanese yen on Monday, with USD/JPY trading near 158.20–158.25 as investors assessed the Bank of Japan’s inflation outlook and the next direction for interest rates. The pair remains above its 20-day exponential moving average (EMA) at 157.87, providing short-term support. However, a symmetrical triangle on the daily chart signals indecision, leaving the next major move dependent on a breakout. Traders are watching 159.00 resistance for a potential advance toward 160.00, while a breakdown could expose the 156.00 area.
Yen Weakness Persists Despite BoJ Signals
The Japanese yen has weakened even as Bank of Japan (BoJ) Governor Kazuo Ueda says underlying inflation is approaching the central bank’s 2% target. Ueda has highlighted stronger demand, a tight labor market and the interaction between wages and prices as factors shaping Japan’s inflation outlook. His remarks suggest the BoJ remains open to further policy normalization, although he has not committed to a specific timetable for additional rate increases. Reuters reported on October 19 that the central bank is balancing inflation risks against financial-market stability. Read the latest BoJ coverage.
Higher Japanese interest rates could support the yen by narrowing the yield gap with other major currencies. Yet uncertainty over the timing of future moves continues to leave the currency vulnerable to shifts in global interest-rate expectations and demand for carry trades, in which investors borrow in lower-yielding currencies to buy higher-yielding assets.
Attention is also turning to Japan’s September Consumer Price Index (CPI), scheduled for release on October 23. The figures could influence expectations ahead of the BoJ’s October 29–30 policy meeting.
USD/JPY Forecast: 157.87 Support Matters
On the daily chart, USD/JPY is trading near 158.20, above its 20-day EMA at 157.87. This moving average tracks recent prices and can act as dynamic support during an advance. The pair is also inside a symmetrical triangle, a chart formation characterized by converging trendlines that often precedes a larger move but does not predict its direction.
The Relative Strength Index (RSI) stands at 53.92, slightly above the neutral 50 mark. This suggests modest positive momentum without indicating that the pair is overbought.
- Immediate support: 157.87 at the 20-day EMA.
- First resistance: 159.00, where buyers must push through to strengthen the bullish case.
- Upside target: 160.00 if the pair breaks higher and momentum holds.
- Downside risk: 156.00 if price breaks below the triangle’s lower boundary.
A sustained move beyond the triangle would provide a clearer directional signal than the current consolidation. A brief intraday move beyond a boundary may not be sufficient confirmation.
What Could Trigger the Next Breakout?
The US dollar’s direction, Japanese inflation data and central-bank guidance will help determine whether USD/JPY extends its advance. The US Dollar Index was recently near 101.90 in the supplied market data, while concerns about French fiscal conditions and elevated bond yields have influenced broader currency trading.
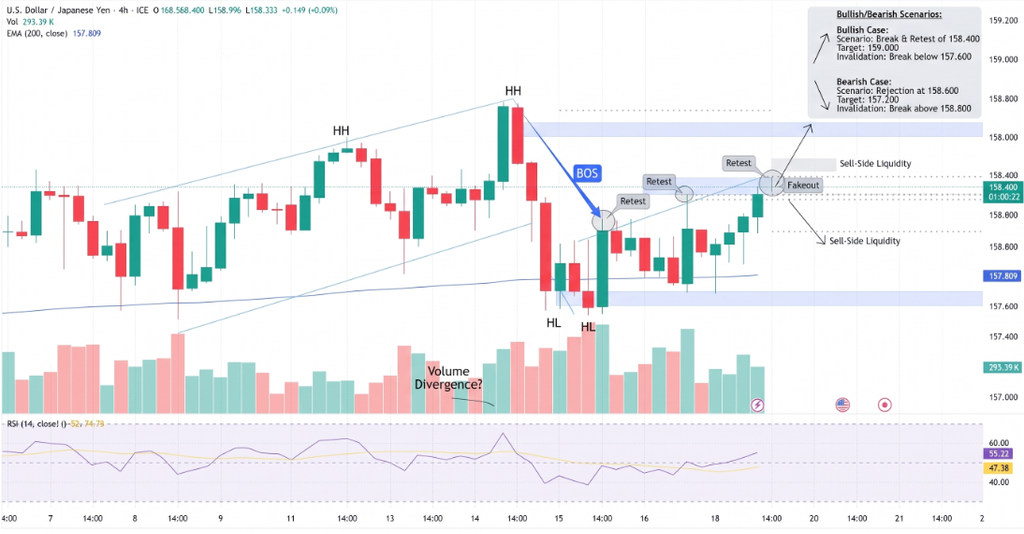
If USD/JPY holds above 157.87 and clears 159.00, traders may turn their attention to 160.00. A decisive break below support, however, would weaken the near-term bullish structure and put 156.00 in focus.
Conclusion:
USD/JPY retains a mildly positive short-term bias while it trades above the 157.87 EMA, but the symmetrical triangle signals that conviction remains limited. A confirmed break above 159.00 could open a path toward 160.00, while a downside break may expose 156.00. Japan’s CPI report and BoJ guidance are likely to be important catalysts for the next move.
Sources & Methodology
Primary-source standard: Market-moving facts should link to original data releases, regulator notices, company filings or official project announcements whenever available. Secondary reporting is used for additional context, not as a substitute for original evidence.
Page last reviewed: