
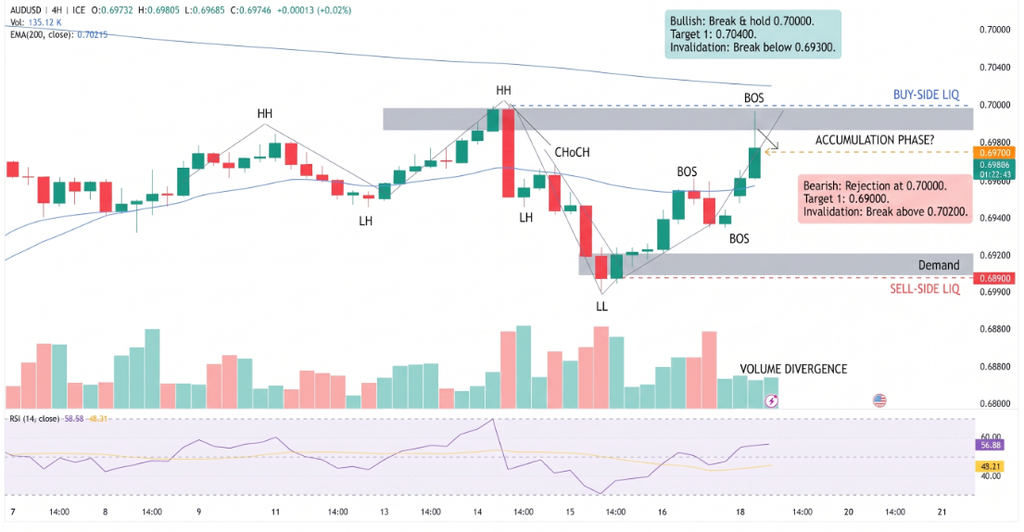
The Australian dollar strengthened at the start of the week, with AUD/USD approaching 0.6980 despite growing doubts about another interest-rate increase by the Reserve Bank of Australia (RBA). The recovery has not yet reversed the pair’s bearish technical structure: the exchange rate remains below its 20-day exponential moving average (EMA) at 0.6993, while the head-and-shoulders pattern places support near 0.6900 in focus. A break below that neckline could deepen losses, whereas a sustained move above resistance would signal improving momentum.
Australian Dollar Gains Despite RBA Doubts
The Australian dollar’s rebound comes against a challenging domestic economic backdrop. The RBA raised its cash rate by 25 basis points to 4.60% on September 29, its fourth increase of 2026, as inflation remained elevated. However, weaker employment data have complicated the case for further tightening. RBA policy information confirms the current rate setting.
Australia lost 39,300 jobs in September, while unemployment rose to 4.7%, its highest level in nearly five years. The report reduced market expectations for another increase at the November meeting. Reuters reported on October 15 that the market-implied probability of a November hike had fallen to around 10%, although the inflation outlook remains a key uncertainty. Reuters’ employment report details the figures.
The shift matters for AUD/USD because interest-rate expectations influence the relative appeal of currencies. If investors expect Australian rates to remain unchanged while US rates stay comparatively attractive, the Australian dollar could face pressure. Still, broad US dollar movements and global risk sentiment can override that relationship in the short term.
AUD/USD Forecast: 0.6900 in Focus
The daily chart retains a bearish near-term bias. AUD/USD is trading below its 20-day EMA at 0.6993, which is the first resistance level buyers need to reclaim. The exponential moving average gives greater weight to recent prices and can help traders identify short-term trend direction.
The Relative Strength Index (RSI) stands at 44, below the neutral 50 threshold. That reading indicates weaker momentum, although it does not establish that another decline is inevitable.
The head-and-shoulders formation adds another warning signal. This pattern features three peaks, with the middle peak higher than the two surrounding peaks. Its neckline near 0.6900 is the critical support area.
- Resistance: 0.6993, the 20-day EMA.
- Key support: 0.6900, the head-and-shoulders neckline.
- Bearish confirmation: A decisive daily close below 0.6900 would strengthen the downside case.
- Recovery signal: A sustained move above 0.6993 would ease immediate selling pressure.
What Could Change the Trend?
A hold above 0.6900 could allow AUD/USD to consolidate while traders assess upcoming Australian inflation data and US dollar direction. A confirmed break below the neckline, however, would indicate that sellers have gained further control. Chart patterns provide possible scenarios, not guaranteed price targets.
The next major catalyst is Australia’s quarterly inflation report, scheduled for October 28, ahead of the RBA’s November policy decision. A stronger-than-expected reading could revive rate-hike expectations, while softer inflation would reinforce the argument for a pause.
Conclusion
AUD/USD’s recovery toward 0.6980 has yet to overturn its bearish technical setup. The 0.6993 EMA is the immediate hurdle, while 0.6900 remains the pivotal support level. Traders should watch price closes and incoming inflation data before treating the rebound as a sustained trend reversal.
Sources & Methodology
Primary-source standard: Market-moving facts should link to original data releases, regulator notices, company filings or official project announcements whenever available. Secondary reporting is used for additional context, not as a substitute for original evidence.
Page last reviewed: