
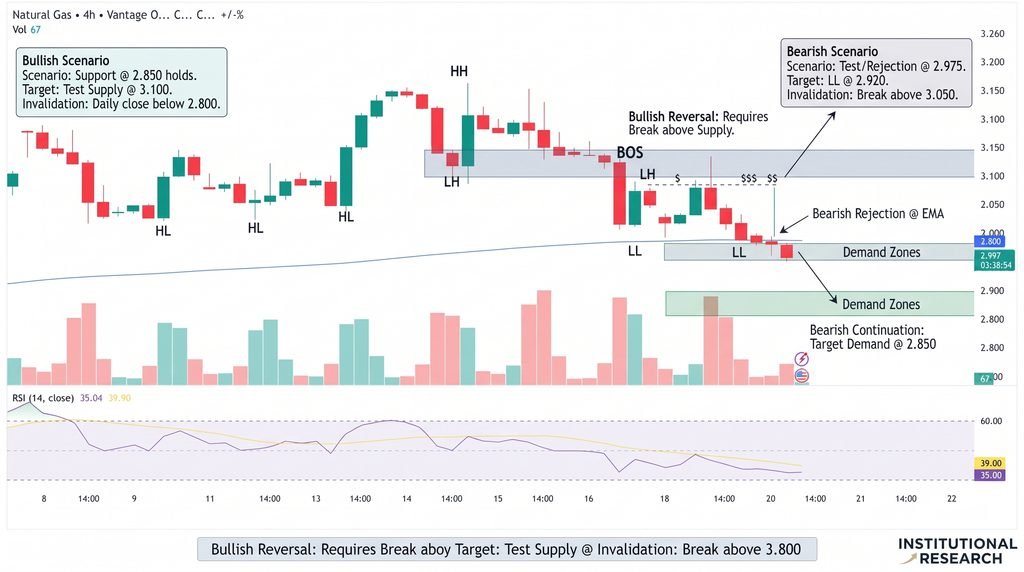
Natural gas prices are testing the psychologically important $3.00 level after a sharp decline on the five-hour chart. At around $3.007, the market is trading close to its 200-period moving average at $3.001, leaving traders watching for confirmation of either a breakdown or a short-term recovery. A completed double-top pattern, weakening momentum and elevated selling pressure favor sellers, while a Relative Strength Index (RSI) reading of 34.22 suggests prices are approaching oversold territory. The next decisive move could determine whether natural gas extends its decline toward $2.890 or rebounds toward $3.150.
Natural Gas Tests $3.00 Support
The natural gas futures market has come under pressure after reversing from approximately $3.334. The resulting double-top pattern—a chart formation that can signal a trend reversal after two failed attempts to break higher—points to deteriorating bullish momentum.
The latest technical snapshot places prices 4.42% below the 20-period moving average. Prices are also below the 20- and 50-period simple moving averages, while the SuperTrend and MACD indicator reinforce the bearish outlook. The 200-period moving average near $3.001 now sits alongside the round-number $3.00 threshold, creating an important test for the market.
Recent market data also show continued pressure on U.S. natural gas futures. On October 19, futures settled around $3.058 per million British thermal units (MMBtu), down approximately 1.9% for the session, as near-term weather expectations weighed on demand prospects. WSJ market coverage reported that comfortable inventories and expectations of milder conditions also tempered the outlook. These fundamental factors can amplify moves suggested by technical indicators.
Key Levels and Trading Scenarios
The immediate question is whether buyers can defend $3.00 on a five-hour closing basis. A brief dip below support is not necessarily a confirmed breakdown; sustained trading beneath the level would provide stronger evidence that selling pressure remains dominant.
The RSI at 34.22 is nearing the commonly watched oversold threshold of 30. That may allow a relief rebound, but oversold readings alone do not confirm that a bottom is in place.
Traders are watching these levels:
- Support: $3.000, aligned with the 200-period moving average.
- Bearish target: $2.890, the next cited Fibonacci support zone.
- Recovery resistance: $3.150, a potential rebound objective.
- Choppy range: $3.005–$3.140, where price swings could produce false signals.
A rise in selling volume during a confirmed break below $3.00 would strengthen the bearish case. Conversely, a recovery above nearby resistance accompanied by stronger buying volume would suggest sellers are losing control.
What Comes Next for Natural Gas?
A sustained five-hour close below $3.00 could expose natural gas to further losses toward $2.890. However, failure to hold below support, followed by a move back above $3.140–$3.150, would weaken the immediate bearish setup and open the door to a short-term recovery.
Conclusion
Natural gas remains vulnerable after the double-top breakdown, but $3.00 is a key level that needs confirmation rather than assumption. Traders should watch closing prices, volume and momentum together, while accounting for weather forecasts and inventory data. Technical levels describe possible scenarios, not guaranteed outcomes.
Sources & Methodology
Primary-source standard: Market-moving facts should link to original data releases, regulator notices, company filings or official project announcements whenever available. Secondary reporting is used for additional context, not as a substitute for original evidence.
Page last reviewed: