
Brent crude oil is caught between resistance near $110.00 and support around $104.30 as traders assess whether the recent rally can resume or a deeper correction is approaching. In the supplied five-hour chart, Brent trades near $107.26, close to its 20-period simple moving average (SMA). A potential double-top formation is limiting bullish momentum, while fading trading volume points to growing hesitation. Separately, Reuters reported Brent at $107.57 on October 18 after prices retreated from a five-month high, underscoring the market’s sensitivity to changing supply expectations.
Brent Oil Tests Key Moving Average
Brent’s immediate direction depends on whether buyers can regain control above the $107–$108 area. The 20-period SMA represents the average closing price over the previous 20 candles and can help traders identify short-term momentum. When prices repeatedly cross this average, the market may lack a clear trend.
The supplied chart identifies $110.00 as major resistance after two unsuccessful attempts to break higher. This resembles a double-top pattern, a technical formation that can signal a bearish reversal when price subsequently breaks support. However, the pattern is not confirmed simply because resistance has been tested twice.
Below the market, the $104.30–$104.60 region combines horizontal support with a SuperTrend reading and the 38.2% Fibonacci retracement. The overlap may attract buyers, although a decisive breakdown would weaken the bullish case.
The broader oil market also faces competing fundamental forces. Reuters reported that Brent fell after the United States temporarily eased certain restrictions affecting Russian fuel exports, raising the possibility of additional supply. At the same time, geopolitical tensions and disruptions to energy shipments continue to threaten global oil flows. These developments can amplify price movements in either direction.
Brent Forecast: Bullish and Bearish Scenarios
The technical setup leaves two main scenarios, with confirmation needed before either becomes more convincing.
- Bullish case: A rebound from $104.30–$104.60 could bring $110.00 back into focus. A sustained breakout above that ceiling would weaken the double-top warning and potentially open the way to higher resistance.
- Bearish case: A firm break below $104.30 could expose $102.00, followed by $97.50 if selling pressure accelerates.
- Neutral case: Continued trading between $106.00 and $108.00 would keep the market range-bound and leave traders without a clear directional signal.
These levels come from the supplied five-hour analysis and are scenario markers, not guaranteed price targets.
Momentum Signals Point to a Decision
The MACD indicator reportedly shows weakening bullish momentum, while the Relative Strength Index (RSI) near 55 is easing from stronger readings. An RSI around 55 is generally neutral to mildly bullish rather than overbought, so it does not independently confirm a bearish reversal.
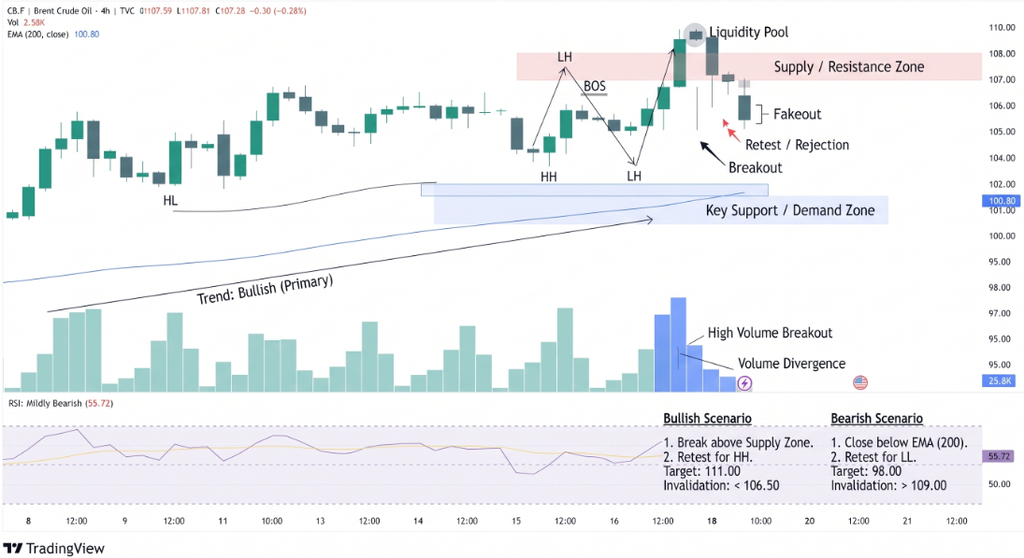
Declining volume near $107.26 may reflect reduced conviction, but volume alone cannot predict the next move. Traders can monitor whether a breakout or breakdown occurs alongside stronger participation.
Conclusion
Brent remains at a technical crossroads, with $110.00 capping recovery attempts and $104.30–$104.60 providing the key downside test. A sustained move outside this range would offer clearer evidence of direction. Until then, the five-hour chart favors patience over assuming that either breakout is inevitable.
Sources & Methodology
Primary-source standard: Market-moving facts should link to original data releases, regulator notices, company filings or official project announcements whenever available. Secondary reporting is used for additional context, not as a substitute for original evidence.
Page last reviewed: