Natural gas is consolidating near $3.19 on the supplied five-hour chart, with prices caught between support at $3.16 and resistance around $3.22. The narrow range follows an earlier rally, while mixed momentum signals leave traders uncertain about the next direction. The price remains near its 200-period Simple Moving Average (SMA) at $3.19, but sits below the 20-period SMA at $3.224. A decisive break beyond either boundary could determine the market’s next short-term move.
Natural Gas Holds a Tight Trading Range
The $3.16–$3.22 band has become the immediate focus for natural gas traders. Price compression occurs when an asset trades within a progressively narrow range, often reflecting a balance between buyers and sellers. However, tightening prices do not guarantee an imminent breakout or reveal which direction it will take.
The broader technical picture remains mixed. Natural gas is holding around its 200-period SMA at $3.19, while the SuperTrend indicator remains positive near $3.162. These levels suggest buyers are still defending the lower end of the range. At the same time, resistance from the 20-period SMA near $3.224 is limiting recovery attempts.
Fading volume indicates reduced participation, which can leave prices vulnerable to sudden moves when fresh buying or selling emerges. Fundamental factors also matter: weather forecasts, production levels, demand for liquefied natural gas (LNG) and weekly storage data can all influence US natural gas futures. On October 16, market reporting showed November futures settling at $3.236 per million British thermal units, while forecasts for moderate autumn weather pointed to potentially softer heating demand.
Key Support and Resistance Levels
The $3.16 support area is especially important because several technical references converge nearby. The 50-period SMA, SuperTrend and 23.6% Fibonacci retracement collectively reinforce this zone in the supplied chart.
The bearish case would strengthen if natural gas closes decisively below $3.16, potentially confirming the double-top pattern identified in the chart analysis. That pattern develops when prices fail near a similar high twice and then break below the intervening support, known as the neckline.
Traders are watching these levels:
- $3.16: Key support and potential double-top neckline.
- $3.22–$3.224: Immediate resistance and the 20-period SMA.
- $3.25: Level above which the bearish scenario weakens.
- $3.06: Potential downside target after a confirmed breakdown.
- $2.98: Deeper support if selling pressure intensifies.
A move above $3.25 would strengthen the bullish case, while a fall below $3.16 could expose lower support.
Breakout Scenarios and Risk Management
The MACD indicator has turned bearish, and repeated lower highs since $3.334 suggest buyers are losing momentum. Yet, the price’s position near the 200-period SMA means a downside continuation is not confirmed.
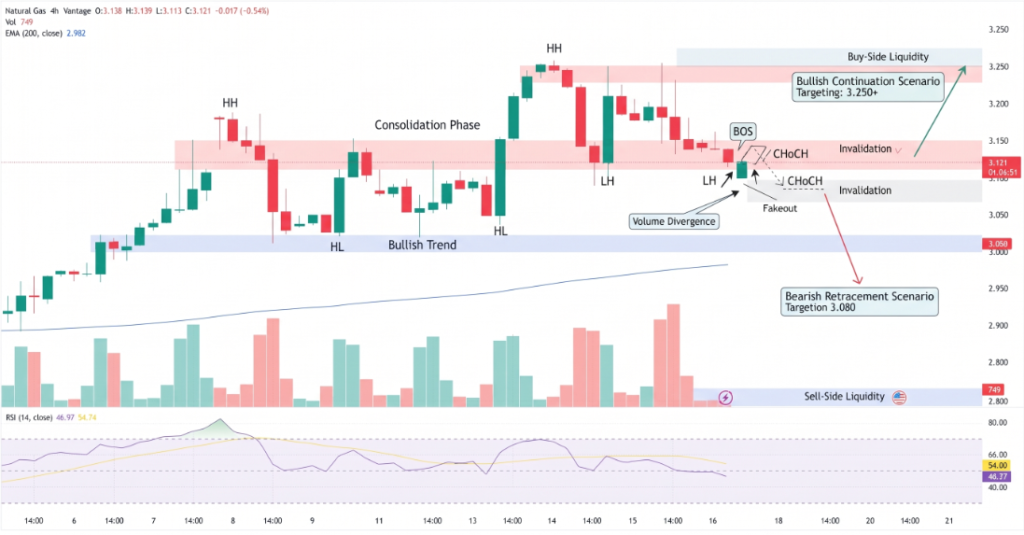
The Average True Range (ATR), at 0.056 or approximately 1.75% in the supplied snapshot, measures typical price movement rather than predicting direction. Traders should account for potential volatility, avoid treating intraday moves as confirmed breakouts and define risk before entering a position.
Conclusion
Natural gas remains confined to a narrow range near $3.19, with $3.16 support and $3.22 resistance setting the immediate boundaries. A confirmed break below support could expose $3.06 and $2.98, while a move above $3.25 would weaken the bearish outlook. Until price escapes the range, mixed momentum and low participation favor caution over directional assumptions.
Sources & Methodology
Primary-source standard: Market-moving facts should link to original data releases, regulator notices, company filings or official project announcements whenever available. Secondary reporting is used for additional context, not as a substitute for original evidence.
Page last reviewed: