
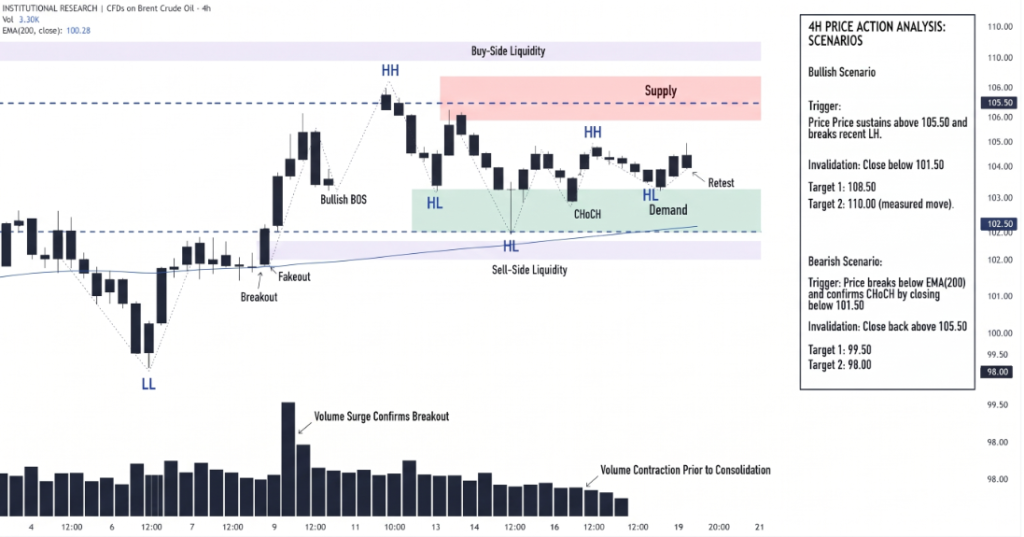
Brent crude oil is consolidating inside a narrow $104–$106 range on the five-hour chart, with the supplied technical snapshot showing a price of $105.33. The market’s Average Directional Index (ADX) reading of 7.14 signals exceptionally weak directional momentum, while a bearish MACD crossover and declining volume point to fading short-term buying pressure. However, prices remain above key trend indicators. The next decisive move could depend on whether buyers defend support or sellers push Brent below the range.
Brent Oil Momentum Weakens Near $105
The narrow trading band reflects a market struggling to establish a clear short-term direction. An ADX reading below 10 generally indicates a weak trend, although it cannot predict when a breakout will occur or which direction prices will take.
Brent remains above its 200-period Simple Moving Average (SMA) at $99.56, while the SuperTrend indicator sits near $102.25. The Ichimoku cloud, spanning $102.19–$105.00, provides another reference for assessing the prevailing trend. These indicators suggest the broader technical structure remains supported, even as near-term momentum fades.
The MACD indicator has weakened, with its main line at 0.46 below the signal line at 0.66. Declining volume adds to concerns that buyers are losing momentum. A doji candlestick near $105.18 also signals indecision, as opening and closing prices are close together.
The wider market backdrop remains important. Reuters reported on October 16 that Brent was trading around $105.42 amid Middle East supply risks and concerns about shipping disruptions near the Strait of Hormuz. These factors may sustain prices, but weaker demand expectations could limit further gains.
Key Brent Oil Breakout Levels
The $104–$106 range defines the immediate trading battle. A move above resistance could attract momentum buyers, while a breakdown may trigger selling toward lower technical support.
Traders are monitoring these levels:
- $106.00: Immediate resistance and potential bullish breakout trigger.
- $104.00: Range support; a sustained break would weaken the near-term outlook.
- $102.25: SuperTrend support that could become relevant after a breakdown.
- $99.56: The 200-period SMA and a deeper technical reference.
An aggressive bullish approach would look for buyers to defend the lower boundary, while a more conservative strategy would wait for a confirmed move above $106.00. Bearish traders could watch for rejection near the upper boundary or a sustained break below $104.00. In either case, confirmation matters more than a brief move beyond the range.
Low Volatility Raises Whipsaw Risk
With ADX at 7.14 and volume declining, Brent may continue to fluctuate without establishing a durable trend. Such conditions can produce false breakouts, where prices briefly cross a key level before reversing. The doji reinforces the need for caution rather than providing a directional signal on its own.
Conclusion
Brent remains supported by its longer-term technical indicators, but weak momentum leaves the next move uncertain. A sustained break above $106.00 could strengthen the bullish case, while a confirmed fall below $104.00 may expose $102.25. Until either boundary gives way, the $104–$106 range remains the clearest guide to short-term price action.
Sources & Methodology
Primary-source standard: Market-moving facts should link to original data releases, regulator notices, company filings or official project announcements whenever available. Secondary reporting is used for additional context, not as a substitute for original evidence.
Page last reviewed: