
Natural gas is trading near $3.247 on the supplied five-hour chart, consolidating after repeated rejection at $3.334. The broader upward trend remains intact because prices are holding above the 200-period simple moving average (SMA) at $2.976. However, a bearish crossover in the Moving Average Convergence Divergence (MACD), easing momentum and declining volume suggest the rally is losing strength. Traders are watching whether buyers can overcome resistance or whether a pullback toward $3.162 will develop.
Natural Gas Faces $3.334 Resistance
The natural gas price remains below $3.334, a resistance level where sellers have repeatedly interrupted the advance. The developing double-top pattern signals a potential reversal if the market fails to break above the previous peak and subsequently falls through support. The pattern is not confirmed simply because price tests resistance twice.
The broader technical picture remains constructive while the price stays above the 200-period SMA at $2.976. Yet the gap between the current price and that average does not rule out a meaningful correction before the longer-term trend changes.
Momentum indicators show signs of deterioration. The MACD line has slipped to 0.0324, below its signal line at 0.0336, producing a bearish crossover. Meanwhile, the Relative Strength Index (RSI) has cooled to 54.37, indicating positive but moderating momentum rather than an overbought market.
Declining volume during the sideways movement adds to the uncertainty. Without stronger participation, a breakout above $3.334 may struggle to sustain itself.
$3.162 Support Is the Key Test
The immediate support zone sits around $3.162, where the supplied chart identifies a confluence of the SuperTrend indicator and a moving average. A decisive break below this area would weaken the bullish structure and could expose the Ichimoku Cloud base near $3.123.
The main levels to monitor are:
- Resistance: $3.334, the double-top ceiling.
- Immediate support: $3.162, a key technical support cluster.
- Secondary support: $3.123, near the cloud base.
- Longer-term trend reference: $2.976, the 200-period SMA.
- Potential upside targets: $3.450 and $3.529 if a confirmed breakout develops.
The area between $3.218 and $3.300 remains a congestion zone in the supplied setup. Trading inside this range offers less directional clarity than a confirmed break above resistance or below support.
Natural Gas Outlook: Breakout or Pullback?
The next move depends on whether buying pressure returns near resistance or selling accelerates around $3.162. A sustained move above $3.334, preferably supported by stronger volume, would challenge the double-top thesis and bring higher targets into focus. Conversely, a support breakdown would strengthen the case for a deeper correction.
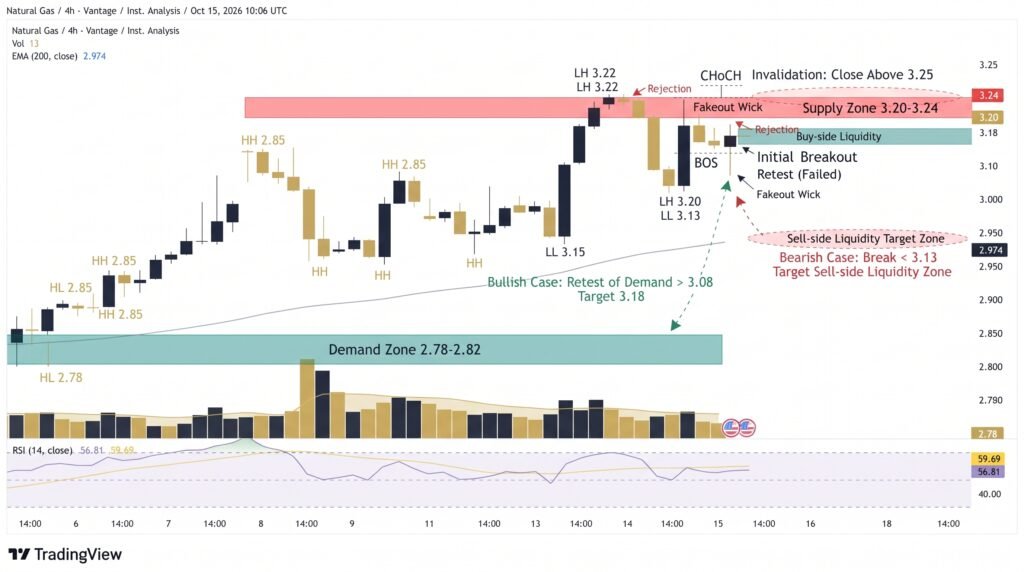
The five-hour Average True Range (ATR) stands at 0.0607, or about 1.87% of the current price. This indicates meaningful short-term price swings and highlights the importance of position sizing and risk controls.
Conclusion:
Natural gas retains its broader upward structure, but fading momentum makes the $3.334 double top a significant obstacle. Holding $3.162 would help preserve the bullish case, while a break below it could expose $3.123. Traders should wait for confirmation rather than assume that either a breakout or reversal is inevitable.
Sources & Methodology
Primary-source standard: Market-moving facts should link to original data releases, regulator notices, company filings or official project announcements whenever available. Secondary reporting is used for additional context, not as a substitute for original evidence.
Page last reviewed: