
Natural gas futures are showing renewed selling pressure after closing a five-hour candle at $3.104, below the Ichimoku cloud and the 50-period simple moving average (SMA). The technical breakdown strengthens the bearish case, placing $3.060 Fibonacci support in focus. If sellers push prices beneath that threshold, the next potential downside area sits near $2.965. However, the 200-period SMA at $2.996 remains an important longer-term reference, while a recovery above $3.160 would weaken the immediate bearish outlook.
Natural Gas Breaks Below Cloud Support
The five-hour chart points to a shift in short-term momentum. Natural gas has moved below the Ichimoku Cloud, a technical indicator used to assess trend direction and potential support or resistance. Price has also fallen beneath the 50-period SMA, suggesting that sellers have gained control of the near-term trend.
A bearish Marubozu candle, which typically features a relatively full body with little or no wick, adds to the negative signal. The chart also indicates rising volume on declining candles, suggesting that selling activity has strengthened.
The MACD remains negative, with a reading of -0.0243 against a signal value of -0.0026. The SuperTrend indicator has also turned bearish. Together, these signals support the downside case, although no single indicator can guarantee the next price move.
Key Levels Define the Next Move
The $3.060 level is the immediate technical test. A decisive close below it would strengthen the bearish setup and could expose the $2.996 area, where the 200-period SMA offers a potential support reference. A further decline could bring $2.965 into view, near the chart’s 50% Fibonacci retracement and the projected profit zone identified by the technical setup.
Traders are also watching $3.160, near cloud resistance. A rebound toward this level could offer a clearer test of whether sellers remain in control.
- Bearish trigger: A sustained break below $3.060 would strengthen downside momentum.
- Potential downside zones: $2.996, followed by $2.965 if selling pressure persists.
- Resistance and invalidation: A strong move back above $3.160 would undermine the immediate bearish outlook.
- Longer-term reference: The 200-period SMA at $2.996 remains important for assessing the broader trend.
The RSI stands near 41, while the Money Flow Index is around 26. These readings indicate weakening momentum and substantial selling pressure, but they do not independently confirm that prices must fall further.
Natural Gas Outlook: $3.060 in Focus
A completed double-top pattern around $3.334 adds to the bearish technical picture. The formation suggests that buyers struggled to push prices beyond a previous high before the market reversed. Still, the pattern’s implications depend on subsequent price action and whether key support levels break.
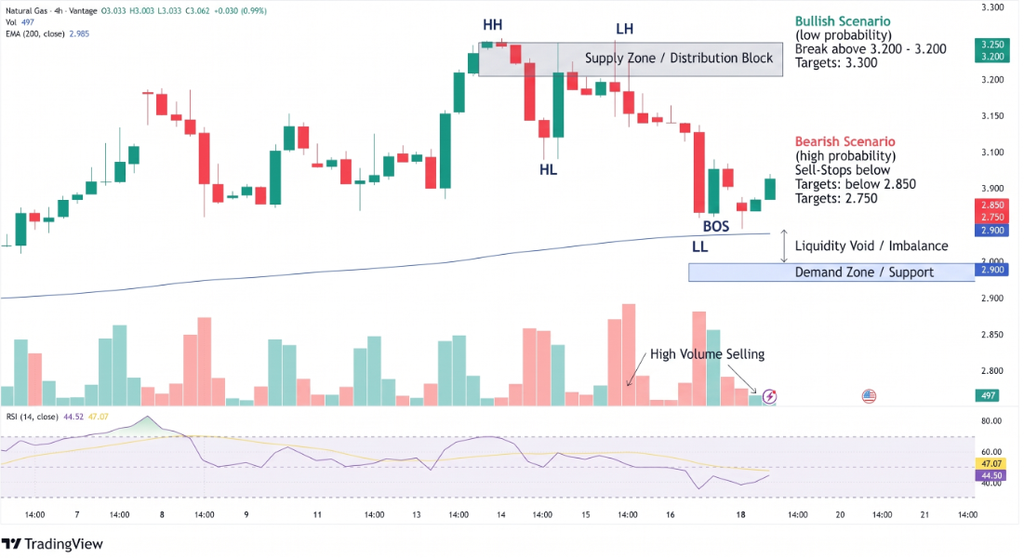
Natural gas is approaching a decision point. A sustained move below $3.060 could open the way toward $2.996 and potentially $2.965. Conversely, a recovery above $3.160 would challenge the bearish setup and increase the risk of a short-term rebound.
Conclusion
The near-term natural gas outlook remains bearish while prices stay below $3.160, but the $3.060 support level is pivotal. Traders should watch for a confirmed candle close rather than react to an intrabar move. Technical levels are scenarios, not guarantees, and natural gas can reverse sharply as weather forecasts, storage data and supply-demand expectations change.
Sources & Methodology
Primary-source standard: Market-moving facts should link to original data releases, regulator notices, company filings or official project announcements whenever available. Secondary reporting is used for additional context, not as a substitute for original evidence.
Page last reviewed: