
Pi Network’s PI token extended its decline on Tuesday, falling nearly 2% as weakening social interest added to an increasingly bearish technical picture. Trading near $0.0772, the token is approaching a critical support zone that could determine whether losses deepen toward its record low of $0.0704. Data from Santiment shows PI’s social dominance has fallen to a six-month low, suggesting the asset is attracting less attention across cryptocurrency discussions. With momentum indicators still pointing lower, traders are watching whether buyers can defend $0.0774 or sellers force another breakdown.
PI Social Interest Falls to Six-Month Low
PI’s declining visibility across crypto-related online discussions points to weaker speculative interest. According to Santiment data cited in the latest market report, PI’s social dominance dropped to 0.03% on Monday, while its social volume registered just 2. Social dominance measures an asset’s share of tracked cryptocurrency discussions, making it a useful gauge of attention rather than a direct measure of buying demand.
Reduced discussion can limit a token’s exposure to potential traders, particularly when price momentum is already negative. However, social metrics alone cannot establish whether investors are selling or simply paying less attention.
The price trend provides additional evidence of weakness. PI remains below its declining resistance trendline, drawn between the June 20 and August 22 highs, near $0.0838. The token is also trading below its 50-period Exponential Moving Average (EMA) at $0.0862 and its 200-period EMA at $0.1221. These averages represent prices over different periods and can help traders identify the prevailing trend.
Technical Levels Point to Further Risk
Momentum indicators continue to favor sellers. The Relative Strength Index (RSI) is hovering around 35, approaching the commonly watched oversold threshold of 30. Meanwhile, the Moving Average Convergence Divergence (MACD) remains in negative territory, with a slightly negative histogram.
A confirmed break below the October 8 low of $0.0774 would strengthen the bearish case and put the $0.0704 swing low in focus. A move beneath that level could leave PI searching for new support, although further declines are not guaranteed.
Key levels to monitor include:
- Immediate support: $0.0774.
- Major downside target: $0.0704, the cited record low.
- First resistance: $0.0838, near the descending trendline.
- Resistance cluster: $0.0862–$0.0867, including the 50-period EMA and 23.6% Fibonacci retracement.
- Higher barriers: $0.1049 and $0.1221.
Can Pi Network Avoid a New Low?
A recovery above $0.0838 would be an early sign that selling pressure is easing. A sustained move through $0.0867 would provide stronger evidence of a rebound, while $0.1049 and $0.1221 remain higher resistance references.
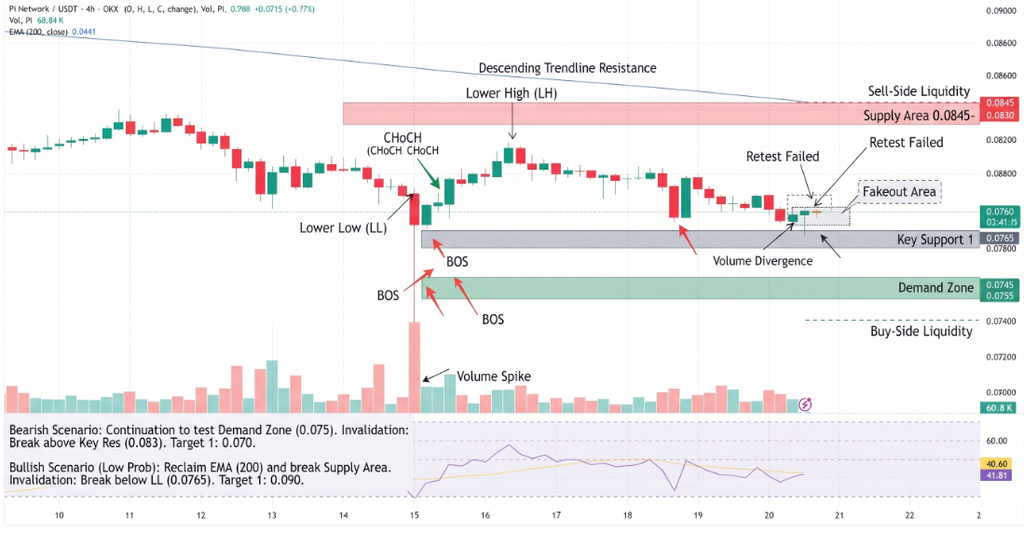
Pi Network Price Chart – Source: Tradingview
Conclusion:
Pi Network faces a difficult near-term outlook as falling social dominance coincides with weak momentum and price below major moving averages. A break under $0.0774 could expose the $0.0704 low, while a recovery above $0.0838 would begin to challenge the bearish structure. Traders should look for confirmed price action rather than treating either scenario as certain.
Sources & Methodology
Primary-source standard: Market-moving facts should link to original data releases, regulator notices, company filings or official project announcements whenever available. Secondary reporting is used for additional context, not as a substitute for original evidence.
Page last reviewed: