
XRP is trading below $1.30 as bearish technical signals and renewed caution around institutional demand weigh on the cryptocurrency. Investors are also assessing the Federal Reserve’s October 27–28 policy meeting, with persistent US inflation complicating the outlook for interest rates. XRP remains below its major daily Exponential Moving Averages (EMAs), while momentum indicators suggest sellers retain control. Recent spot exchange-traded fund (ETF) outflows add another concern, although cumulative investment flows remain substantial. The next test is whether buyers can reclaim $1.34 or whether continued weakness exposes XRP to further losses.
XRP ETF Demand Shows Signs of Weakness
Market positioning remains cautious ahead of the Federal Reserve’s policy decision. The supplied derivatives data show XRP perpetual futures open interest averaging 2.21 billion XRP on Tuesday, up from 2.16 billion the previous day. Open interest measures the number of outstanding derivatives contracts and can help indicate market participation, but rising figures do not reveal whether traders are predominantly bullish or bearish.
The latest data also show open interest remains below September’s 2.46 billion XRP and August’s 2.77 billion XRP peaks. This suggests derivatives participation has not returned to earlier levels.
Institutional demand has also weakened. US spot XRP ETFs recorded approximately $1.84 million in net outflows for the week ending October 16, ending a 13-week streak of weekly inflows, according to SoSoValue data. The withdrawal was modest relative to the funds’ roughly $1.47 billion in net assets, so it does not alone establish a broad institutional exit.
Technical Outlook Keeps XRP Under Pressure
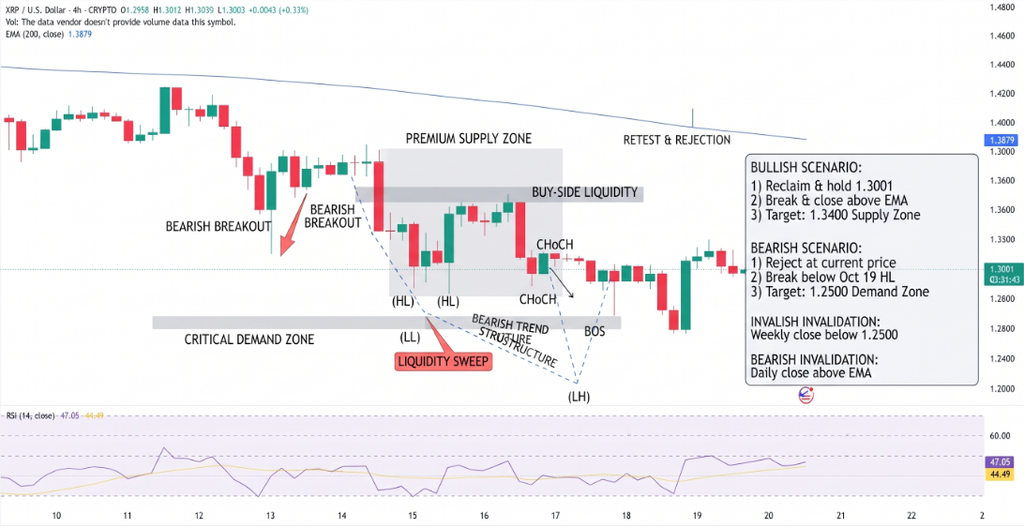
XRP remains below its 100-day EMA near $1.34 and the 50-day and 200-day EMAs clustered around $1.38. These moving averages can act as resistance when prices trade underneath them, making a sustained recovery more difficult.
The Relative Strength Index (RSI) is around 35, close to the commonly watched oversold threshold of 30. Meanwhile, the MACD indicator remains negative, indicating that downward momentum persists despite signs that the sell-off may be slowing.
Key levels traders are watching include:
- Initial resistance: $1.34, near the 100-day EMA.
- Major resistance: Around $1.38, where the 50-day and 200-day EMAs converge.
- Higher recovery barrier: $1.46, near the SuperTrend indicator.
- Immediate concern: A continued decline below $1.30, where the supplied technical setup identifies no clear nearby structural support.
A move above $1.34 would be an early sign of improving momentum. Reclaiming $1.38 would provide stronger evidence that buyers are challenging the prevailing bearish structure.
Fed Decision Could Shape XRP’s Next Move
The Federal Reserve’s October meeting is a key near-term event for digital assets. The central bank raised its benchmark interest-rate target to 3.75%–4.00% in September, while inflation remained above its 2% goal. Markets are weighing whether policymakers will hold rates steady in October or signal further tightening later in the year.
Higher rates can weigh on speculative assets by keeping borrowing costs elevated and reducing the appeal of risk-taking. However, XRP’s price will also depend on crypto-specific demand, derivatives positioning and broader market sentiment.
Conclusion
XRP’s outlook remains bearish while the token trades below $1.34 and the $1.38 EMA cluster. ETF outflows and negative momentum add pressure, although the latest fund withdrawal was small relative to assets under management. A sustained recovery above resistance could improve sentiment; continued weakness below $1.30 would leave the token vulnerable to further losses.
Sources & Methodology
Primary-source standard: Market-moving facts should link to original data releases, regulator notices, company filings or official project announcements whenever available. Secondary reporting is used for additional context, not as a substitute for original evidence.
Page last reviewed: