
West Texas Intermediate (WTI) crude oil slipped below $99 on the five-hour chart, closing its latest candle at $98.93 in the supplied snapshot. The retreat leaves prices between support near $98 and resistance around $101, with traders watching whether buyers can reclaim a key Fibonacci level. Although the broader technical structure remains constructive, weakening momentum signals and limited trading volume suggest that WTI may struggle to establish a clear direction without a decisive breakout.
WTI Tests Key Fibonacci Resistance
WTI recently attempted to hold above the 61.8% Fibonacci retracement at $99.24, a level traders use to assess potential turning points during price corrections. The failure to maintain that threshold places the spotlight on nearby support and the next resistance zone.
The broader technical picture still offers some support for buyers. Prices remain above the 200-bar simple moving average (SMA) at $93.34, while the SuperTrend indicator stands at $96.54. The Ichimoku Cloud spans $94.93–$98.02, placing the latest close near its upper boundary.
However, the market is showing signs of hesitation. A bearish MACD crossover points to weakening short-term momentum, while the Average Directional Index (ADX) reading of 21.86 suggests that trend strength remains limited. A doji candle near $99.32 also indicates indecision between buyers and sellers.
WTI Price Forecast: Bullish vs. Bearish
The next move depends largely on whether WTI can regain resistance or lose nearby support. A sustained move above $99.24 would improve the bullish outlook, although the $101 area remains a significant hurdle. A rejection near that ceiling could instead return prices toward the lower end of the range.
The key levels to monitor are:
- $101.00 resistance: A sustained breakout could open the way for further gains.
- $99.24 resistance: Reclaiming the 61.8% Fibonacci level would strengthen the recovery case.
- $98.00 support: A break below this area could expose prices to further weakness.
- $96.54 support: The SuperTrend level represents a deeper technical reference if selling accelerates.
These levels are conditional scenarios, not guaranteed price targets. Traders typically seek confirmation through candle closes, momentum indicators and changes in volume before interpreting a breakout as sustainable.
Oil Consolidation Keeps Traders Cautious
WTI remains within an ascending channel, but the pattern has not yet confirmed a decisive continuation. The supplied technical assessment estimates that the formation is about 70% complete, making the next move particularly important for determining whether the trend remains intact.
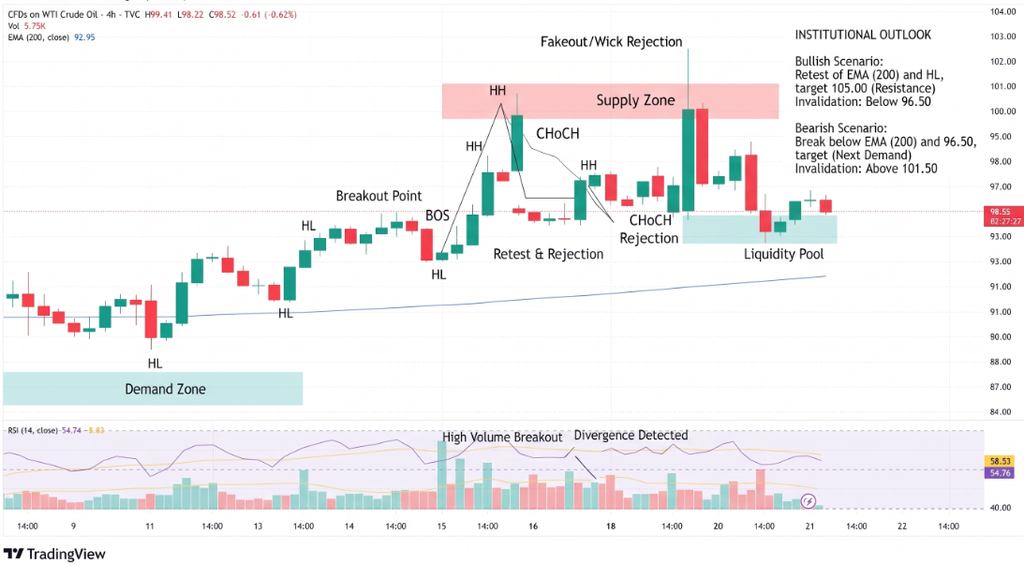
Thinning volume adds uncertainty because a price move without broader participation can struggle to sustain momentum. Traders will therefore watch whether buying activity increases above resistance or selling pressure intensifies beneath support.
Broader energy-market developments also matter. Geopolitical risks, crude inventories and expectations for global oil demand can move prices independently of chart patterns. Reuters reported on October 21 that WTI rose to $99.27 amid concerns over Middle East supply disruptions and declining U.S. crude inventories.
Conclusion
WTI crude oil’s retreat to $98.93 places the $99.24 Fibonacci threshold at the center of the near-term outlook. A confirmed recovery above resistance could support further gains toward $101, while a breakdown below $98 would weaken the technical structure. Until either move gains confirmation, the market remains vulnerable to choppy trading, changing momentum and fresh supply-side headlines.
Sources & Methodology
Primary-source standard: Market-moving facts should link to original data releases, regulator notices, company filings or official project announcements whenever available. Secondary reporting is used for additional context, not as a substitute for original evidence.
Page last reviewed: