
Brent crude oil is trading at $111.35 on the supplied five-hour chart, approaching a recent peak of $111.99 and a critical resistance zone around $112. The repeated test of this ceiling raises the possibility of a double-top pattern, which can signal a reversal if buyers fail to push prices higher. However, Brent remains above its 200-period simple moving average at $101.41 and the SuperTrend indicator at $105.89. The next move depends on whether buying pressure can overcome resistance or fading momentum triggers a retreat toward support.
Brent Oil Tests Key $112 Resistance
The $111.99–$112.00 zone is the immediate focus for traders. A double top develops when prices test a similar high twice but struggle to break through, potentially indicating that demand is weakening. The pattern is not confirmed simply because prices approach the same level; a subsequent decline through support is generally needed to strengthen the reversal signal.
Momentum readings suggest caution. The Moving Average Convergence Divergence (MACD) line has slipped to 1.1394, just below its signal line at 1.1420, indicating that short-term upward momentum may be fading. The Average Directional Index (ADX) stands at 12.4. Because readings below 20 typically indicate a weak trend, Brent could remain volatile within a range rather than establish a decisive direction immediately.
Nevertheless, the broader technical structure remains constructive while prices hold above the longer-term moving average and SuperTrend support. A sustained move above $112 would weaken the double-top argument and could attract breakout buyers. The next upside reference points would be $115 and, if buying continues, $118.
Support Levels Define the Downside Risk
Brent’s near-term direction also depends on whether buyers defend the support zones beneath the market. The $109.35 area is an initial reference for a pullback, while $108.35 represents a more important technical floor where previous price reactions and indicator levels converge.
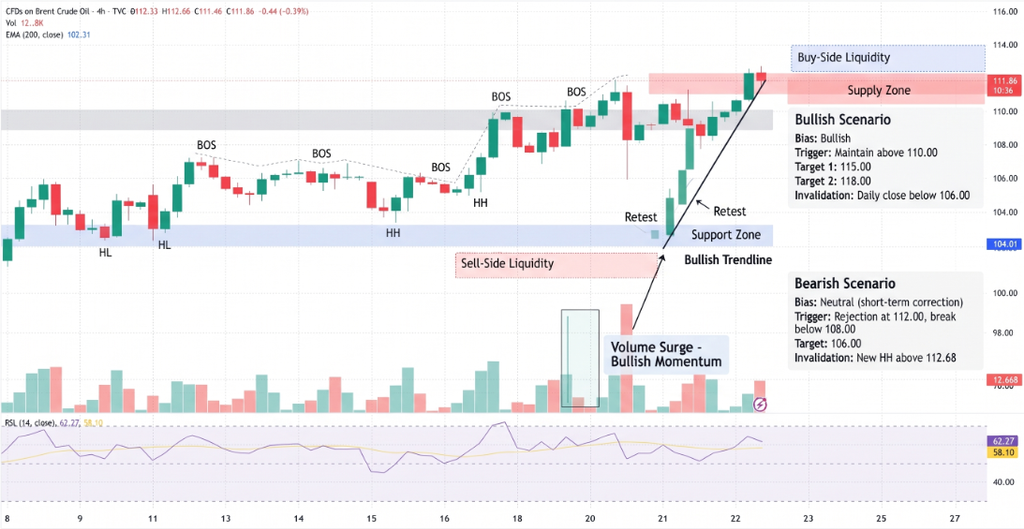
A decisive break below $108.35 would weaken the bullish structure and increase the possibility of a deeper correction. The $105.55–$105.89 zone, where the supplied Fibonacci and SuperTrend levels cluster, would then become a key area to monitor.
Traders should distinguish between an intraday dip and a confirmed breakdown. A brief move below support can reverse quickly, especially when the ADX indicates limited trend strength. Closing levels and follow-through therefore matter more than a single price spike.
Key levels from the supplied chart include:
- $111.99–$112.00: Major resistance and potential breakout trigger.
- $109.35: Near-term pullback reference.
- $108.35: Important support; a break would strengthen bearish risk.
- $105.55–$105.89: Lower support zone around SuperTrend and Fibonacci levels.
- $115 and $118: Potential upside targets following a confirmed breakout.
Conclusion
Brent crude is approaching a decisive technical area, but neither a breakout nor a reversal is confirmed. A sustained move above $112 would favor further gains toward $115, while rejection followed by a break below $108.35 would strengthen the downside case. Until price action confirms either outcome, the market may remain vulnerable to sharp swings around resistance. Traders should monitor momentum, support confirmation and broader oil-market developments rather than treat the potential double top as an established reversal.
Sources & Methodology
Primary-source standard: Market-moving facts should link to original data releases, regulator notices, company filings or official project announcements whenever available. Secondary reporting is used for additional context, not as a substitute for original evidence.
Page last reviewed: