
NEAR Protocol (NEAR) fell 5% on Thursday to $4.99, erasing most of the previous session’s 6% recovery as weakening momentum put its broader uptrend under pressure. Mixed flows into Bitwise’s NEAR-focused exchange-traded fund (ETF) have raised questions about the strength of institutional demand, although futures positioning has increased. The immediate outlook depends on whether buyers can defend support near $4.70 and $4.44 or whether selling pressure pushes the token toward $3.91. Resistance around $5.44 remains a key hurdle for any sustained recovery.
NEAR ETF Flows Signal Mixed Demand
Institutional demand for NEAR has become less consistent following three consecutive weeks of positive ETF inflows. According to SoSoValue data cited by FXStreet, Bitwise’s NEAR ETF (NRR) recorded $2.54 million in outflows on Tuesday before attracting $830,700 on Wednesday.
The fund reportedly accumulated $3.71 million in net inflows during the week through Thursday’s report, including $5.42 million on Monday. The conflicting daily figures suggest that investors remain active but are not buying consistently.
Bitwise launched NRR on September 29, giving U.S. investors access to NEAR through a listed investment product. The fund also intends to stake its holdings to generate potential network staking rewards. However, ETF flows alone do not establish the direction of NEAR’s future price. Investors should distinguish between daily fund activity and sustained changes in demand.
Meanwhile, NEAR futures open interest, which measures the value of outstanding derivatives contracts, climbed to $1.67 billion from $1.47 billion on Monday. Rising open interest can indicate that traders are adding positions, but it does not reveal whether those positions are bullish or bearish.
Technical Analysis: Support Under Pressure
NEAR traded below its four-hour 50-period Exponential Moving Average (EMA) at $5.03 but remained above the 200-period EMA at $4.61. This configuration suggests short-term weakness within a potentially intact broader recovery structure.
The Relative Strength Index (RSI) stood at 47, below its neutral midpoint of 50, indicating that upward momentum had weakened. The Moving Average Convergence Divergence (MACD) indicator also threatened a bearish crossover, which could reinforce selling pressure if confirmed.
Key technical levels include:
- $5.44: Resistance that buyers must overcome to strengthen recovery prospects.
- $4.70: Rising trendline support identified in the supplied analysis.
- $4.44: September 25 low and an important downside threshold.
- $3.91: Potential support if $4.44 breaks decisively.
- $6.00: Upside reference if NEAR clears $5.44 and sustains its advance.
NEAR Price Outlook and Key Risks
The immediate outlook remains cautious as NEAR struggles to recover $5.00. A sustained move above $5.44 could restore bullish momentum and bring $6.00 into focus. Conversely, a confirmed break below $4.44 would weaken the broader technical structure and expose the $3.91 level.
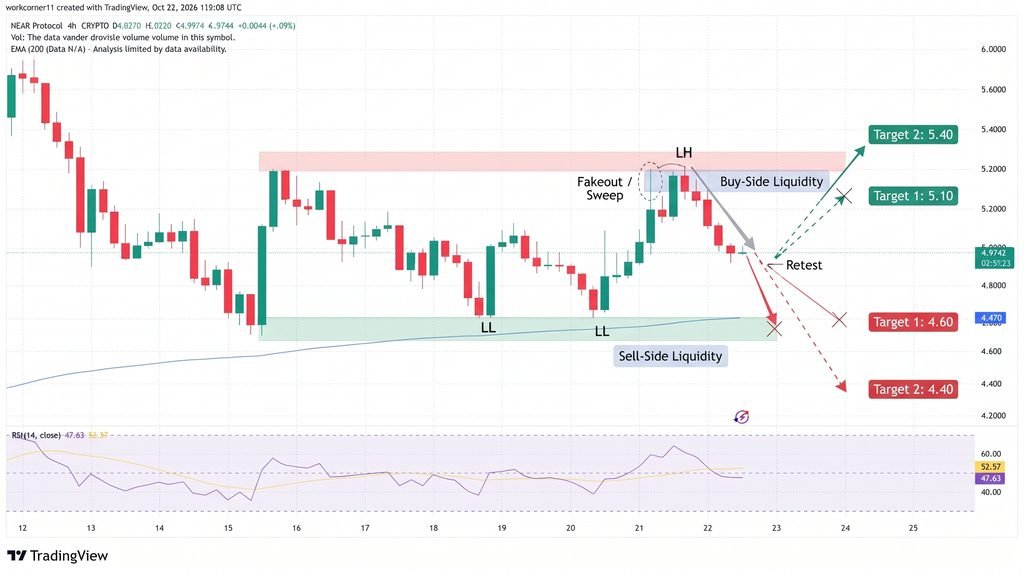
Traders should also monitor ETF flows and futures positioning for evidence of changing demand. Increased open interest without corresponding price strength may reflect growing speculative activity rather than renewed conviction among buyers.
Conclusion
NEAR Protocol faces a corrective phase as its price declines, technical momentum weakens and ETF flows become less consistent. Support at $4.70 and $4.44 will be important in determining whether the broader recovery survives. A break above $5.44 would improve the bullish outlook, while a decisive move below $4.44 could open the way toward $3.91. Neither outcome is confirmed, making price action and capital-flow data essential signals to monitor.
Sources & Methodology
Primary-source standard: Market-moving facts should link to original data releases, regulator notices, company filings or official project announcements whenever available. Secondary reporting is used for additional context, not as a substitute for original evidence.
Page last reviewed: