
The EUR/USD price forecast remains bearish as the pair trades near 1.1210 during Friday’s European session, pressured by rising French borrowing costs and persistent fiscal concerns. France’s 10-year government bond yield surged above 5%, reaching its highest level since 2002, while the widening gap between French and German yields highlighted growing investor anxiety. Meanwhile, expectations of further European Central Bank (ECB) tightening and uncertainty surrounding Federal Reserve policy are keeping currency traders focused on upcoming economic data and key technical levels.
French Debt Concerns Pressure the Euro
France’s deteriorating fiscal outlook has emerged as a significant headwind for the euro. The French 10-year government bond yield climbed to 5.1415% before easing, while its spread over German government bonds widened sharply. Higher borrowing costs can increase pressure on public finances and weaken investor confidence, creating additional challenges for the single currency.
Political uncertainty has added to the strain, with public protests and difficulties reaching agreement on fiscal measures complicating efforts to control government debt. Investors are watching whether these pressures will spread across European financial markets.
The ECB is expected to keep its deposit rate at 2.50% at its October meeting, following its September increase. However, Rabobank expects another increase in December, arguing that inflation risks remain elevated but do not currently justify accelerating monetary tightening.
Meanwhile, Federal Reserve Chair Kevin Warsh has highlighted the investment surge linked to artificial intelligence while maintaining a data-dependent approach to monetary policy. His emphasis on inflation, employment and economic output leaves the future US interest-rate path uncertain. Differences in expected policy decisions between the Fed and ECB could influence EUR/USD direction.
EUR/USD Technical Analysis: Key Levels
The daily chart signals continued downside pressure, with EUR/USD trading below its 100-day simple moving average (SMA) and the middle line of the Bollinger Bands. The 14-day Relative Strength Index (RSI) stands near 38, below the neutral 50 threshold, indicating that sellers retain an advantage.
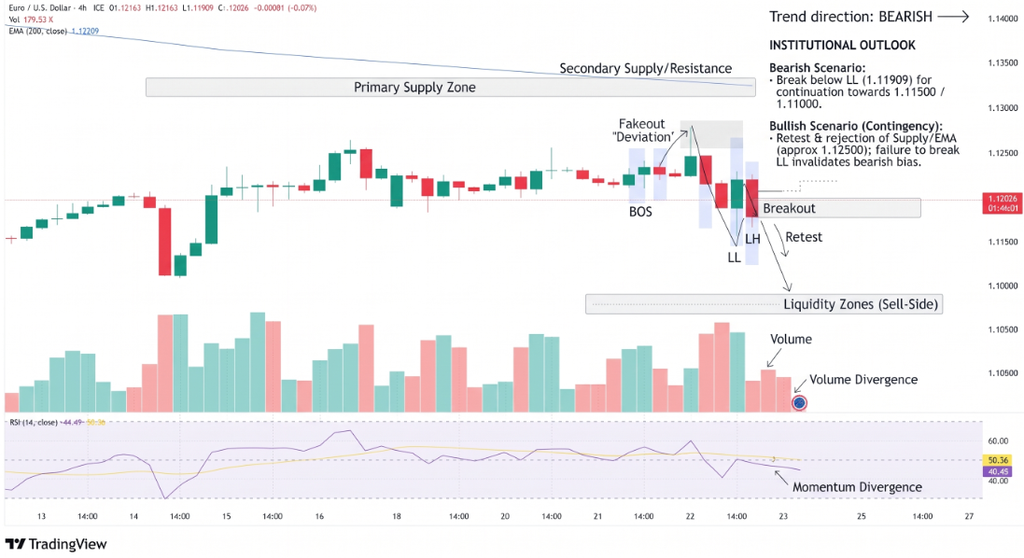
The following levels are important for traders:
- Immediate resistance: 1.1235, near the Bollinger middle band.
- Major resistance: 1.1345, around the upper Bollinger Band.
- Longer-term resistance: 1.1451, near the 100-day SMA.
- Initial support: 1.1185, the October 19 low.
- Further support: 1.1125, near the lower Bollinger Band.
A sustained break below 1.1125 could expose the May 12, 2025, low at 1.0951. Conversely, a recovery above 1.1235 would offer initial relief, although stronger resistance remains overhead.
Conclusion
EUR/USD faces a combination of French fiscal uncertainty, cautious ECB expectations and an unresolved Federal Reserve outlook. With the pair below its 100-day SMA and RSI near 38, the technical bias remains negative. A decisive break below 1.1125 could extend losses toward 1.0951, while a move above 1.1235 would be the first indication of improving short-term momentum. Traders should monitor bond-market developments, central-bank guidance and incoming economic data before drawing conclusions about the next sustained move.
Sources & Methodology
Primary-source standard: Market-moving facts should link to original data releases, regulator notices, company filings or official project announcements whenever available. Secondary reporting is used for additional context, not as a substitute for original evidence.
Page last reviewed: