The USD/CAD price forecast remains technically bearish as the pair trades near 1.4010 on Friday, extending a six-session losing streak. The Canadian dollar has benefited from the US dollar’s retreat, but weaker Canadian growth expectations could limit its recovery. Fresh projections from the International Monetary Fund (IMF) point to a widening economic gap between the United States and Canada, potentially supporting USD/CAD over the longer term. For now, traders are watching whether the pair can reclaim its short-term moving averages or extend its decline toward the May low at 1.3732.
US-Canada Growth Gap Pressures CAD
The latest IMF economic forecasts have reinforced concerns about Canada’s relative growth outlook. According to strategists at Societe Generale, US economic growth is projected at 2.5% in 2026 and 2.1% in 2027, compared with Canada’s weaker outlook.
The IMF’s October projections put Canadian growth at approximately 1.1% in 2026 and 1.7% in 2027, while the US economy is expected to expand more quickly. Societe Generale’s analysis highlights an even wider difference in its cited comparison for 2027, with Canada at 1.2% against 2.1% for the United States. These figures reflect different forecast presentations, but both point to slower Canadian growth.
A stronger US economy can support the dollar by attracting investment and sustaining expectations for comparatively firm interest rates. Meanwhile, weaker Canadian activity could constrain the Canadian dollar, particularly if markets anticipate a more accommodative policy stance from the Bank of Canada.
Two-year government bond yield differentials are another important driver. When US yields rise relative to Canadian yields, dollar-denominated assets can become more attractive, potentially pushing USD/CAD higher. However, Societe Generale cautions that the growth gap may already be reflected partly in exchange rates, limiting the scope for further gains.
USD/CAD Technical Analysis: Key Levels
On the daily chart, USD/CAD remains below its nine-day and 50-day exponential moving averages (EMAs), positioned at 1.4091 and 1.4069, respectively. These indicators track recent price trends and may now act as resistance.
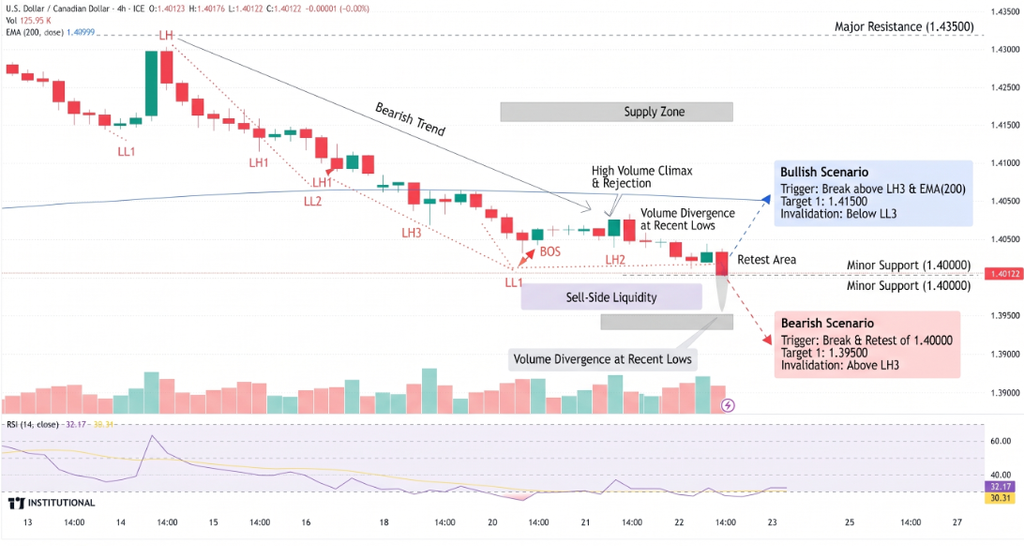
The 14-day Relative Strength Index (RSI) near 38 indicates persistent selling pressure, although the pair has not entered conventional oversold territory below 30.
Traders should monitor these levels:
- Immediate resistance: 1.4069 at the 50-day EMA.
- Secondary resistance: 1.4091 at the nine-day EMA.
- Major upside target: 1.4299, the October 14 high.
- Initial downside reference: 1.3732, the May 21 low.
- Deeper support: 1.3481, the lowest level since October 2024.
A sustained move above both EMAs could improve the short-term outlook, while continued weakness would keep the May low in focus.
Conclusion
USD/CAD remains under near-term pressure, but the widening US-Canada growth gap offers fundamental support for the US dollar. A recovery above 1.4091 would weaken the immediate bearish setup, while renewed selling could expose 1.3732. The next sustained move will depend on price action, relative interest-rate expectations and incoming economic data from both countries.
Sources & Methodology
Primary-source standard: Market-moving facts should link to original data releases, regulator notices, company filings or official project announcements whenever available. Secondary reporting is used for additional context, not as a substitute for original evidence.
Page last reviewed: