Silver remains under pressure near $53.82 as a bearish consolidation pattern points to the possibility of another decline. The supplied technical chart identifies an active bear flag that is approximately 80% complete, while the Average Directional Index (ADX) stands at 43.08, indicating a strong prevailing trend. With prices below key moving averages, traders are watching $52.71 support for confirmation of a breakdown. A sustained recovery above $54.64, however, would challenge the bearish setup and could trigger a broader rebound.
Silver Bear Flag Keeps Sellers in Control
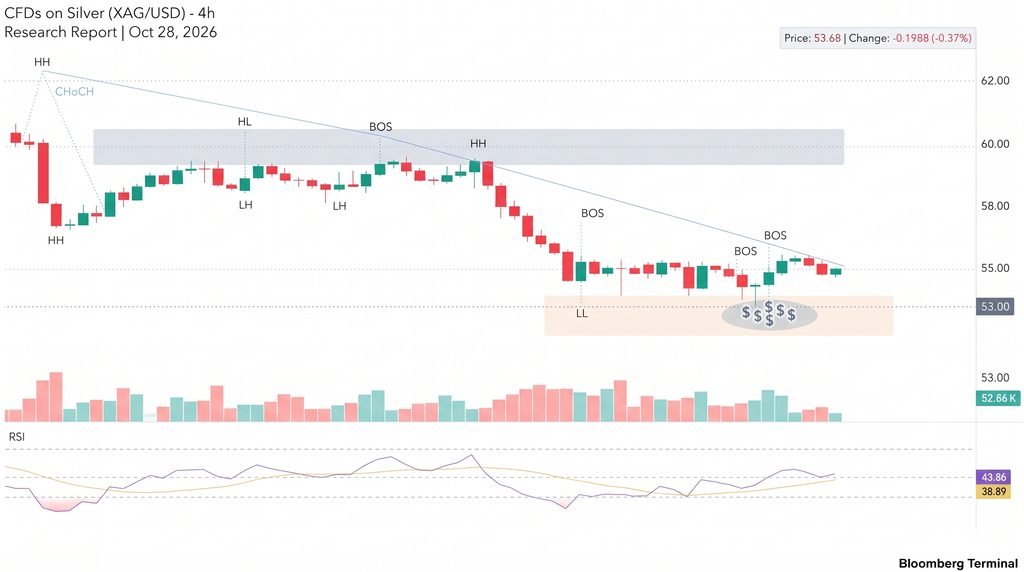
The silver price has been consolidating after a sharp decline, forming what the supplied chart identifies as a bear flag near $53.815. This pattern typically appears when prices pause or recover modestly during a broader downtrend. A confirmed break below the consolidation range can signal renewed selling, although the pattern does not guarantee further losses.
The wider technical structure favors bears. Silver trades below its 20-, 50- and 200-period simple moving averages, while the SuperTrend indicator points lower at $55.74. The ADX reading of 43.08 reinforces the view that the existing trend is strong. However, ADX measures trend strength rather than direction, so price action and other indicators remain important.
There are early signs of stabilization. The MACD indicator shows a bullish crossover, with its reading improving from -0.85 to -0.71, while the Relative Strength Index (RSI) has recovered to 39.27. Both remain consistent with a market attempting to stabilize without yet confirming a reversal. Declining volume during consolidation also leaves the next directional move uncertain.
Key Silver Levels and Trade Scenarios
The $52.71 swing low is the immediate support level. A sustained break below it could expose silver to the $51.56–$51.52 area, near the chart’s calculated 161.8% Fibonacci extension. Further downside levels sit at $50.25 and $48.00, although each would require additional selling pressure to come into view.
The main levels to monitor are:
- Support: $52.71, followed by $51.52, $50.25 and $48.00.
- Resistance: $54.14–$54.64, followed by $55.74.
- Bullish invalidation: A sustained move above $56.04 would weaken the immediate bearish structure.
- Volatility: The Average True Range (ATR) is 0.75, or approximately 1.39% of the quoted price.
A five-hour close below $52.71 would strengthen the bearish case. Conversely, a sustained move above $54.64 could signal improving momentum and bring $56.46 and $57.06 into focus. These levels are conditional chart scenarios, not guaranteed targets.
Conclusion
Silver’s near-term outlook remains bearish while prices trade below the $54.14–$54.64 resistance zone. Strong trend readings, bearish moving-average alignment and the active bear flag favor sellers, but the improving MACD and RSI caution against assuming that another breakdown is inevitable.
Reuters reported silver near $53.82 an ounce on October 28, down about 1%, as rising oil prices heightened inflation concerns ahead of the Federal Reserve decision. Higher-for-longer interest rates can weigh on non-yielding precious metals by supporting bond yields and the U.S. dollar. Traders should watch whether silver breaks $52.71 or reclaims resistance before drawing conclusions about its next major move.
Sources & Methodology
Primary-source standard: Market-moving facts should link to original data releases, regulator notices, company filings or official project announcements whenever available. Secondary reporting is used for additional context, not as a substitute for original evidence.
Page last reviewed: