Silver extended its decline on October 30, trading near $50.85 as technical indicators pointed to a powerful five-hour downtrend. The metal’s Relative Strength Index (RSI) had fallen to 22.55, signaling deeply oversold conditions, while the Average Directional Index (ADX) stood at 45.80, indicating strong trend momentum. The combination leaves silver vulnerable to further losses, although an oversold market can also produce sharp corrective rebounds.
Silver Downtrend Strengthens Below $53.50
The supplied five-hour technical dashboard shows silver trading below its 20-, 50- and 200-period simple moving averages. This alignment reflects broad selling pressure across the selected timeframe. The SuperTrend indicator also points lower, placing resistance near $53.43.
Momentum indicators reinforce the bearish structure. The RSI at 22.55 is well below the commonly watched 30 threshold, while the Commodity Channel Index (CCI) at -199 indicates an unusually stretched decline. However, these readings do not establish that selling has ended. The ADX reading of 45.80 suggests that the prevailing trend remains strong.
The dashboard also identifies a completed bear-flag breakdown near $53.50. A bearish Marubozu candle at $50.85 on October 30, combined with expanding volume and no reported bullish divergence, adds evidence that sellers remain in control.
The Average True Range (ATR) is $0.826, approximately 1.62% of the quoted price. Silver is also trading about 4.57% below its 20-period moving average, highlighting the scale of its short-term extension.
$49.50 Support Becomes the Next Test
The immediate downside focus is $50.00, a major psychological level. Below it, the dashboard identifies $49.49 as the 161.8% Fibonacci extension, calculated from the $53.03-$58.76 price range.
That creates a potential support zone between $49.50 and $50.00. A sustained break beneath this area would weaken the prospect of an immediate technical rebound and expose silver to further downside.
The main levels to monitor are:
- Immediate support: $50.00.
- Extended downside target: $49.49.
- First resistance zone: $52.70-$53.43.
- Major invalidation level: $53.43 for the bearish setup.
- Bearish invalidation: A sustained move below $49.50 would challenge the current downside framework.
Silver Forecast: Rebound or Further Losses?
Despite the bearish trend, short sellers face a timing risk. An RSI reading below 30 and CCI near -200 can precede a short-covering rebound, particularly after an extended decline. But neither indicator confirms a reversal without stronger price action.
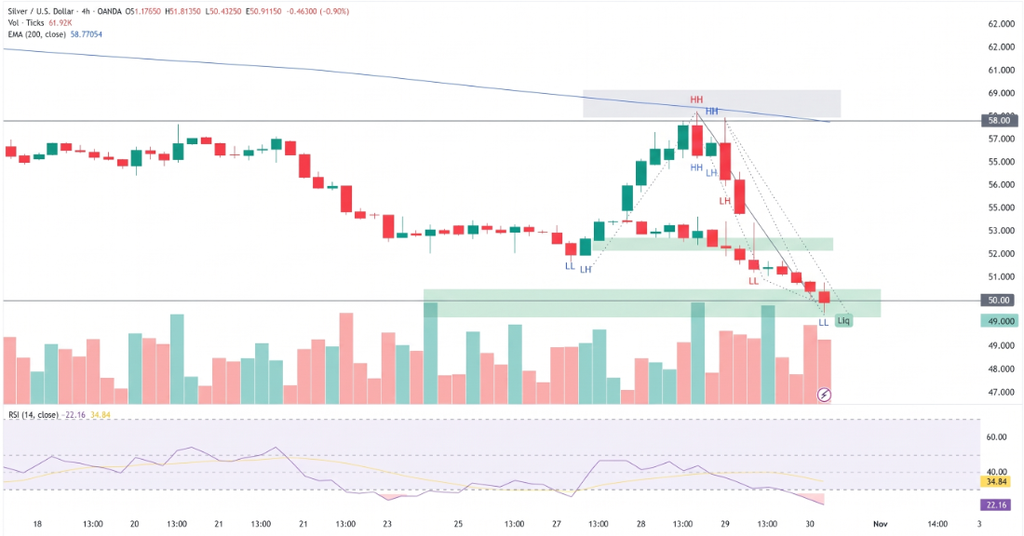
The dashboard identifies $52.70-$53.43 as a potential area to watch for renewed selling if silver rebounds. A recovery into that range followed by rejection could provide evidence that sellers are regaining control. A sustained move above $53.43, however, would invalidate the immediate bearish setup.
Conclusion
Silver’s five-hour structure remains firmly bearish, with $49.50 the next major downside reference. Yet chasing prices near $50.85 carries considerable risk because momentum is already stretched. A confirmed break below support or a failed rebound toward resistance would offer clearer evidence of the market’s next direction.
Sources & Methodology
Primary-source standard: Market-moving facts should link to original data releases, regulator notices, company filings or official project announcements whenever available. Secondary reporting is used for additional context, not as a substitute for original evidence.
Page last reviewed: