
Natural gas is consolidating near $2.899 on the five-hour chart, with bearish technical indicators pointing to the risk of another decline. The price is testing its 38.2% Fibonacci retracement at $2.892, while remaining below the 200-period moving average at $2.999. A decisive break under $2.89 could expose the $2.73 support area. Meanwhile, a recovery toward $3.00 would test whether buyers can reverse the prevailing downward trend.
Natural Gas Bears Retain Control
The supplied technical dashboard shows natural gas trading below its 200-period simple moving average (SMA) of $2.999. The SuperTrend indicator also remains bearish, with resistance near $2.989. These signals suggest sellers retain control despite the market’s recent stabilization.
The Moving Average Convergence Divergence (MACD) indicator reinforces the negative outlook. Its reading of -0.0028 remains below the signal line at -0.0019, indicating that bearish momentum has not yet reversed.
However, some indicators suggest that selling pressure could temporarily ease. The Relative Strength Index (RSI) has recovered to 48.05, moving away from oversold territory. The Money Flow Index (MFI), at 22.63, remains relatively low and suggests limited buying pressure.
Natural gas also trades above the Ichimoku Kijun line at $2.848, providing a nearby short-term reference for support. Nevertheless, a doji candle near $2.899 on October 30 signals indecision rather than a confirmed bullish reversal. The active bear-flag pattern adds to the risk of another downward move.
$2.89 Support Holds the Key
The immediate technical battle is taking place around the 38.2% Fibonacci retracement at $2.892. This level represents an important test for buyers following the preceding decline.
A sustained break below $2.89 could expose the trendline support near $2.73. If selling accelerates, the 127.2% Fibonacci extension at $2.496 becomes a deeper downside reference.
On the upside, the $2.97-$3.03 region contains several resistance indicators, including the 50% Fibonacci retracement at $2.977, the 200-period SMA and SuperTrend resistance.
Key levels include:
- Immediate support: $2.892-$2.89.
- Major downside support: $2.73.
- Extended bearish target: $2.496.
- First resistance zone: $2.97-$3.03.
- Bullish invalidation: A sustained recovery above $3.00.
Natural Gas Forecast: Bearish Risks Persist
The bearish scenario remains relevant while prices stay below $3.00. A failed recovery toward $2.97-$3.03 could attract renewed selling, particularly if MACD remains negative and the SuperTrend signal does not change.
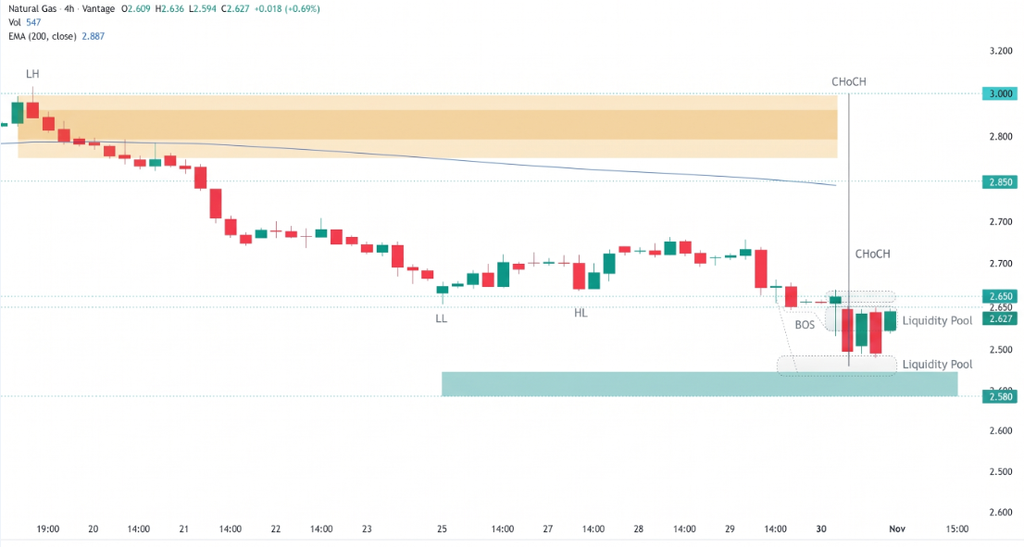
Conversely, a sustained move above $3.00 would weaken the immediate bearish structure and potentially open the way toward the $3.05 trendline resistance.
Fundamentals also matter. The U.S. Energy Information Administration reported an 80-billion-cubic-foot storage injection for the week ending October 23. Inventories reached 3,724 Bcf, standing 38 Bcf above the five-year average. The larger-than-expected build and forecasts for warmer weather through early November added pressure to U.S. natural gas prices by limiting near-term heating demand.
Conclusion
Natural gas remains technically vulnerable, with $2.89 serving as the immediate downside threshold and $2.73 the next major support. A recovery above $3.00 would challenge the bearish outlook, but until that happens, sellers retain the technical advantage.
Sources & Methodology
Primary-source standard: Market-moving facts should link to original data releases, regulator notices, company filings or official project announcements whenever available. Secondary reporting is used for additional context, not as a substitute for original evidence.
Page last reviewed: