
The US Dollar Index (DXY) fell to around 101.25 on Wednesday, reaching its weakest level since late September as US midterm results triggered a reassessment of the political and economic outlook. Falling Treasury yields added to pressure on the Greenback, while expectations of another Federal Reserve rate increase and escalating tensions around the Strait of Hormuz offered some support. The election result has since confirmed Democratic control of both chambers of Congress, raising the prospect of legislative gridlock during President Donald Trump’s remaining two years in office.
Election results weigh on the dollar
The US Dollar Index measures the Greenback against a basket of six major currencies. Its decline towards 101.25 reflected investor concerns that a change in congressional control could complicate the administration’s fiscal and economic agenda.
Democrats secured majorities in both the House of Representatives and the Senate, delivering a significant setback to Republicans. The result is expected to constrain Trump’s legislative priorities and increase congressional scrutiny of the administration.
Markets initially responded to the possibility of political deadlock by moving away from the dollar and pushing Treasury yields lower. Falling yields reduce the relative return available from US government debt, potentially making dollar-denominated assets less attractive.
However, the election outcome does not automatically imply weaker economic growth or lower government spending. The market impact will depend on how Congress approaches taxation, fiscal policy and government funding.
Fed rate expectations limit dollar losses
Monetary policy provides a counterweight to the dollar’s decline. Market pricing cited in the original report showed more than a 75% probability of a Federal Reserve rate increase in December, reflecting concerns that inflation could remain persistent.
The latest JOLTS report, released by the Bureau of Labor Statistics on November 3, showed US job openings rising to 7.5 million in September, above economists’ expectations of approximately 7.1 million. The openings rate increased to 4.5%, while hiring reached 5.4 million.
A resilient labor market could give the Federal Reserve more room to maintain restrictive monetary policy. Traders are therefore watching upcoming employment and services-sector indicators for evidence that economic demand remains strong enough to sustain inflation pressures.
Wednesday’s calendar includes the ADP private-sector employment report and the ISM Services PMI, with the next major focus on the US employment report.
DXY technical outlook: 101.25 in focus
The four-hour chart shows a bearish near-term structure after the index moved below its 200-period Simple Moving Average (SMA). The immediate test is the 38.2% Fibonacci retracement at 101.26.
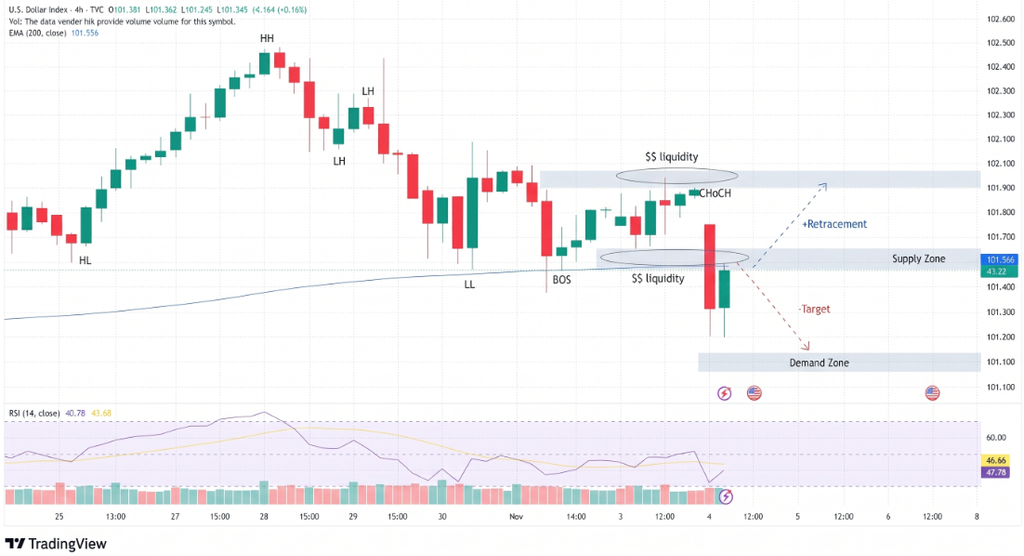
A sustained break below this area could expose further downside levels:
- First support: 100.75, followed by 100.24.
- Deeper support: 99.51 and 98.59.
- Initial resistance: 200-period SMA at 101.71.
- Higher resistance: 101.89 and the cycle level near 102.92.
Geopolitical developments could also disrupt the technical outlook. Iran’s Revolutionary Guard claimed that four tankers were destroyed after striking mines south of the Strait of Hormuz, although independent confirmation of the reported incidents was not available in the initial account.
Conclusion
The DXY’s retreat towards 101.25 reflects political uncertainty and weaker Treasury yields, but hawkish Fed expectations and Middle East risks may limit further losses. A sustained break below 101.26 would strengthen the bearish technical case, while a recovery above 101.71 could signal stabilisation.
Sources & Methodology
Primary-source standard: Market-moving facts should link to original data releases, regulator notices, company filings or official project announcements whenever available. Secondary reporting is used for additional context, not as a substitute for original evidence.
Page last reviewed: