
Solana traded below $92 on Wednesday, extending a difficult run for the cryptocurrency as weak institutional demand, bearish derivatives positioning and deteriorating technical indicators weighed on sentiment. SOL has lost more than 3.5% this week and is approaching a sixth consecutive weekly decline since late September. With the token trading below its major daily moving averages and momentum indicators near oversold territory, traders are assessing whether support around $88.80 can prevent a deeper correction.
ETF outflows and bearish bets weigh on SOL
Demand for US-listed spot Solana exchange-traded funds has remained subdued this week, following heavy withdrawals in the previous week. Data from SoSoValue showed that the funds recorded their largest weekly net outflows since launch during the period cited in the original report. The reversal in fund flows has weakened a potential source of institutional buying support.
ETF flows matter because they provide an indication of investor demand through regulated investment products. Persistent withdrawals do not necessarily predict further price declines, but they can leave an asset more exposed when broader market sentiment is already weak.
Derivatives positioning also reflects caution. CoinGlass data put SOL’s long-to-short ratio at 0.92 on Wednesday. A reading below one indicates that short positions outweigh long positions among the accounts measured by the metric. The ratio was approaching its lowest level in more than a month, suggesting traders were increasingly positioning for further weakness.
Meanwhile, CryptoQuant market indicators pointed to large whale orders and sell-side dominance across spot and futures markets. Its assessment also highlighted overheated conditions in the spot market. Large orders can increase short-term volatility, although their presence alone does not establish the direction of future prices.
SOL technical outlook: $88.80 at risk
Solana was trading around $91.26, below its 50-day exponential moving average (EMA) at $102.78, 100-day EMA at $99.61 and 200-day EMA at $98.39. This positioning leaves all three averages above the market, creating a broad resistance zone that could restrict any rebound.
Momentum remains weak. The 14-day Relative Strength Index was near 26, placing it in commonly defined oversold territory. The Moving Average Convergence Divergence indicator also remained below zero, consistent with negative momentum.
An oversold RSI can signal that selling has become stretched, but it does not guarantee an immediate reversal. SOL would need to reclaim nearby resistance levels to provide stronger evidence that buyers are returning.
Important chart levels include:
- Immediate support: $88.80, near the former trendline break area.
- Major downside support: $78.35.
- First resistance: $97.76.
- Moving-average resistance: $98.39, $99.61 and $102.78.
- Higher resistance: $122.76.
Institutional demand remains key to recovery
Solana’s near-term direction will depend partly on whether ETF flows stabilise and derivatives positioning becomes less defensive. A return of sustained fund inflows could help improve demand, while continued withdrawals would leave the market more reliant on spot buyers.
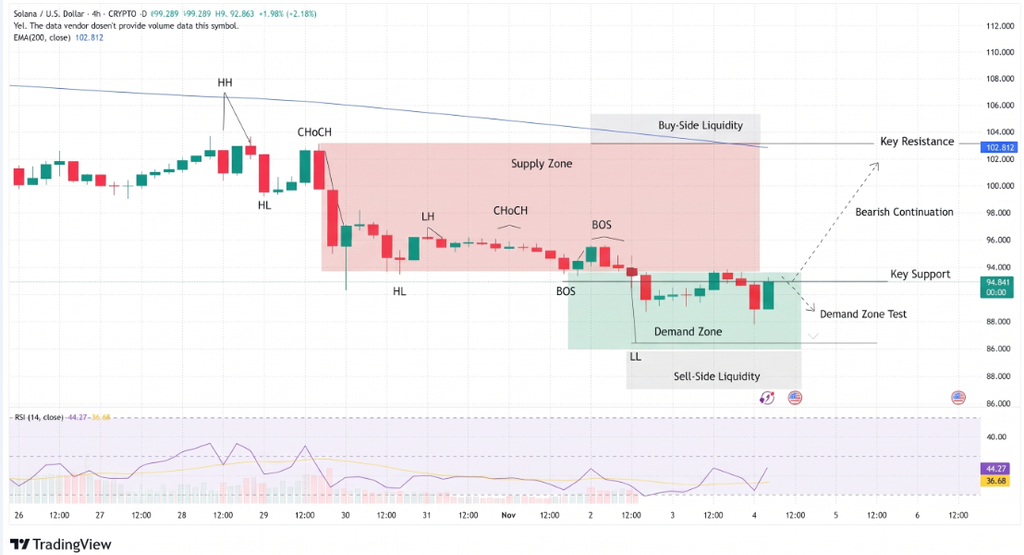
The $88.80 area is the first important downside reference. A decisive break could expose $78.35, where stronger buying interest may emerge. On the other hand, a recovery above $97.76 would put the moving-average resistance cluster back in focus.
Conclusion
Solana’s decline below $92 reflects weak fund demand, bearish trader positioning and a deteriorating chart structure. The RSI near 26 suggests selling is stretched, but a durable recovery will require SOL to defend $88.80 and regain key moving averages. Until then, the downside risk remains elevated.
Sources & Methodology
Primary-source standard: Market-moving facts should link to original data releases, regulator notices, company filings or official project announcements whenever available. Secondary reporting is used for additional context, not as a substitute for original evidence.
Page last reviewed: