
Ethereum remained under pressure near $2,280 on Tuesday, struggling to reclaim the $2,309 realized-price level as institutional investment flows and technical indicators pointed to persistent selling. The token had briefly held above this on-chain cost benchmark for more than a week before falling below it after the $6.3 billion Binance security breach on October 29. A retest of $2,250 support, however, suggests buyers are still defending lower levels.
Realized price caps Ethereum recovery
Ethereum’s realized price, estimated at $2,309, represents the average price at which coins last moved on-chain. Traders often monitor the metric to assess whether the broader holder base is sitting on unrealized gains or losses.
ETH’s inability to recover this level over the past two days suggests sellers are becoming active as the market approaches a major cost-basis threshold. When prices fall below realized price, some investors may sell to limit losses, although this response is not automatic and depends on broader market conditions.
The Binance incident intensified uncertainty across digital assets. Blockchain investigators estimated that approximately $6.3 billion in cryptocurrency left the exchange’s hot wallets during the October 29 breach. Binance said it would cover customer losses, while its co-CEO later reported that most affected tokens had been replenished.
US ETF outflows signal weak demand
US investment flows remain a concern for Ethereum. On November 2, US spot ETH exchange-traded funds recorded approximately $139.8 million in net withdrawals, extending their losing streak to six consecutive trading sessions. The funds also registered a record $1.61 billion in net outflows during October.
The Coinbase Premium Index also remained negative at -0.161. The indicator compares Ethereum’s price on Coinbase with its price on Binance and is commonly used to gauge relative buying and selling pressure among US-based traders.
A negative reading can indicate weaker demand on Coinbase, but it does not independently prove that US investors account for all market selling. A sustained improvement in ETF flows and the premium index would provide stronger evidence that institutional and US-market demand is recovering.
ETH technical outlook: $2,250 support
Ethereum’s daily chart retains a bearish near-term structure. The token trades below its 20-day EMA at $2,352, 100-day EMA at $2,345 and 50-day EMA at $2,411. These moving averages form a resistance cluster that could restrict recovery attempts.
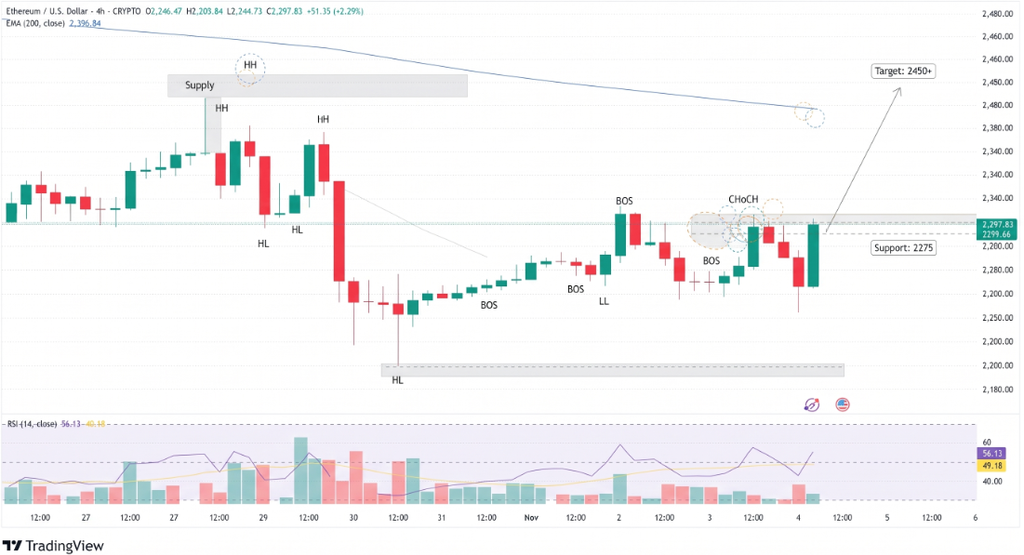
Momentum indicators also remain subdued. The 14-day Relative Strength Index sits near 39, while the Stochastic Oscillator is around 34. Both readings point to weak momentum, although neither confirms that a market bottom has formed.
Key technical levels include:
- Support: $2,250, followed by $2,204 and $2,107.
- Lower support: $1,971 and $1,827.
- Initial resistance: $2,345–$2,355, around the EMA cluster.
- Higher resistance: $2,411, $2,548, $2,636 and $2,781.
Conclusion
Ethereum’s recovery depends on defending $2,250 and reclaiming the $2,309 realized price. Continued ETF withdrawals and negative Coinbase premium readings leave sellers with the advantage. A sustained move above the nearby EMA resistance zone would offer a more convincing sign that bearish pressure is easing.
Sources & Methodology
Primary-source standard: Market-moving facts should link to original data releases, regulator notices, company filings or official project announcements whenever available. Secondary reporting is used for additional context, not as a substitute for original evidence.
Page last reviewed: