
Solana (SOL) traded below $90 on Monday, November 9, recovering slightly after losing more than 3% in the previous session. The cryptocurrency remains under pressure after five consecutive weeks of declining prices, coinciding with nearly $170 million in outflows from Solana-focused exchange-traded funds (ETFs). Weakening derivatives activity, falling futures open interest and negative funding rates indicate that traders remain cautious. With SOL breaking below its long-term support trendline and major moving averages, the $77 region has emerged as an important downside target.
ETF Outflows and Futures Selling Pressure
Persistent institutional withdrawals are adding to Solana’s bearish market structure. According to SoSoValue, Solana investment products recorded approximately $170 million in net outflows over five weeks. The latest weekly withdrawals reached $26.25 million, while the largest weekly outflow during the period totaled $71.47 million.
Sustained redemptions suggest weakening institutional demand as investors reduce exposure amid broader cryptocurrency market uncertainty. A return to positive weekly ETF flows could provide an early indication that institutional sentiment is improving.
Meanwhile, CoinGlass data shows that SOL futures open interest declined to $5.10 billion on Monday, its lowest level since August 19. This represents a substantial reduction from the October 8 peak of $7.62 billion.
Open interest measures the value of outstanding derivatives contracts. Its decline indicates that traders are closing positions rather than establishing substantial new exposure, reducing speculative participation in the market.
Other derivatives indicators also reinforce the bearish outlook:
- Funding rate: -0.0033%, indicating a short-side positioning imbalance.
- Long liquidations: $33.64 million on Sunday.
- Short liquidations: $1.35 million on Sunday.
- Futures open interest: $5.10 billion, down from $7.62 billion.
The significantly higher value of long liquidations suggests that bullish traders faced greater forced position closures during Sunday’s decline.
Solana Price Forecast: $77 Support
SOL traded around $87.60 on Monday, extending its weakness after declining approximately 8% last week. The cryptocurrency also recorded a 19% decline in October, reflecting persistent selling pressure since early autumn.
Technically, Solana has fallen below its 200-day Exponential Moving Average (EMA) at $99.26 and breached a long-term ascending trendline near $90.41. The trendline connected the June 6 and August 1 lows, making its breakdown an important development for the broader price structure.
The 50-day EMA at $100.35 is also approaching a potential bearish crossover below the 200-day EMA. Such a formation, known as a death cross, could reinforce expectations of a longer-term downward trend if confirmed.
Momentum indicators remain weak. The Relative Strength Index (RSI) is near 29, approaching oversold territory, while the Moving Average Convergence Divergence (MACD) remains negative.
SOL Resistance and Downside Targets
The immediate support level is around $87.46. A sustained move below this area could expose the more significant demand zone near $77.60.
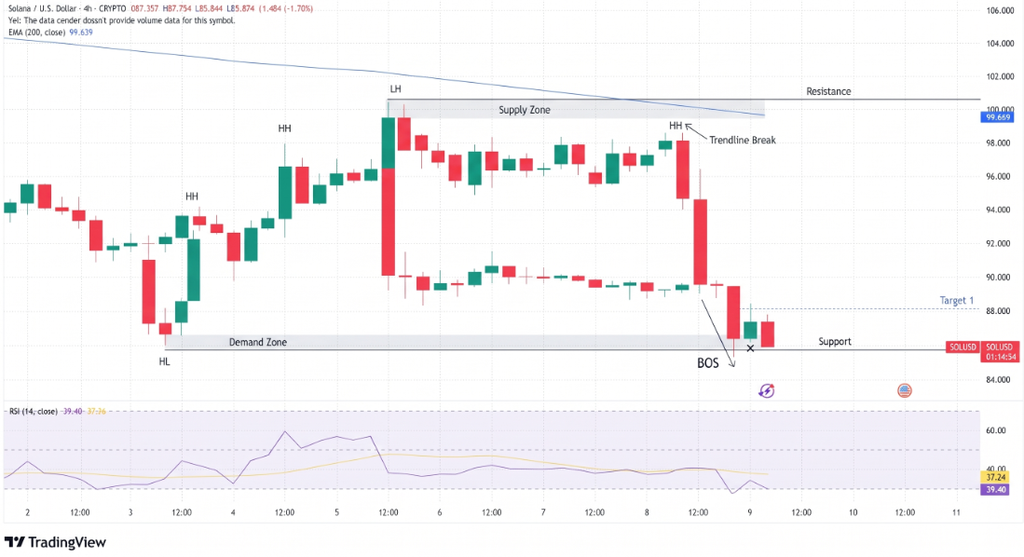
Additional technical levels include:
- $87.46: Immediate support.
- $77.60: Major downside target.
- $67.50: Secondary support.
- $60.13: Deeper structural support.
- $90.41: Initial recovery resistance.
- $95.82: Next upside barrier.
Conclusion
Solana faces mounting downside risks as institutional ETF withdrawals, declining futures participation and negative funding rates reinforce bearish sentiment. A recovery above $90.41 would offer an initial sign of stabilization, while a move beyond $95.82 would strengthen the recovery case. However, continued selling below $87.46 could expose SOL to $77.60, making institutional inflows and derivatives positioning essential indicators for the next market direction.
Sources & Methodology
Primary-source standard: Market-moving facts should link to original data releases, regulator notices, company filings or official project announcements whenever available. Secondary reporting is used for additional context, not as a substitute for original evidence.
Page last reviewed: