
Pi Network (PI) extended its decline on Tuesday, November 17, hitting a reported all-time low of $0.0551 as selling pressure intensified. The token has fallen more than 20% since early November, pushing its market capitalization below $700 million. Weak derivatives positioning, negative risk-adjusted returns and deteriorating technical indicators suggest bearish sentiment remains dominant. Although oversold conditions could support a temporary rebound, the broader market structure indicates that buyers have yet to establish a sustainable recovery.
PI market cap drops below $700 million
Pi Network touched $0.0551 during Tuesday’s early Asian trading session, marking a new record low in the reported market data. The cryptocurrency has remained under pressure since mid-May, with its decline accelerating in November.
Its market capitalization fell to approximately $692 million, reflecting the impact of the declining token price. PI has also shed more than 20% since early November, highlighting the extent of the recent selling pressure.
The decline in market value raises concerns about investor confidence and demand. However, market capitalization represents token price multiplied by circulating supply; it does not necessarily indicate the amount of money withdrawn from the market.
PI derivatives show bearish positioning
Derivatives data from Blockworks highlights deteriorating sentiment among Pi Network traders. The Open Interest (OI)-weighted funding rate turned negative on Monday and declined to -0.00048% on Tuesday.
In perpetual futures markets, negative funding means traders holding short positions pay those holding long positions. This generally reflects stronger demand for bearish exposure, although funding rates can change quickly as market positioning evolves.
Another concerning indicator is PI’s one-year Sharpe Ratio, which dropped to -1.54 on Tuesday. The Sharpe Ratio measures investment returns relative to volatility. A negative reading indicates that the asset delivered negative risk-adjusted performance over the measured period.
The latest figures highlight the extent of market weakness:
- Funding rate: -0.00048%, indicating bearish futures positioning.
- One-year Sharpe Ratio: -1.54, reflecting negative risk-adjusted returns.
- Market capitalization: Approximately $692 million.
- Monthly performance: More than 20% decline since early November.
These indicators reinforce the cautious outlook as traders assess whether the latest decline has created an attractive entry point or signals further weakness.
Pi Network price forecast: $0.0551 in focus
PI trades near $0.0600 on Tuesday after recording a reported record low of $0.0551. The token remains below its 50-day, 100-day and 200-day Exponential Moving Averages (EMAs) at $0.0763, $0.0850 and $0.1083, respectively.
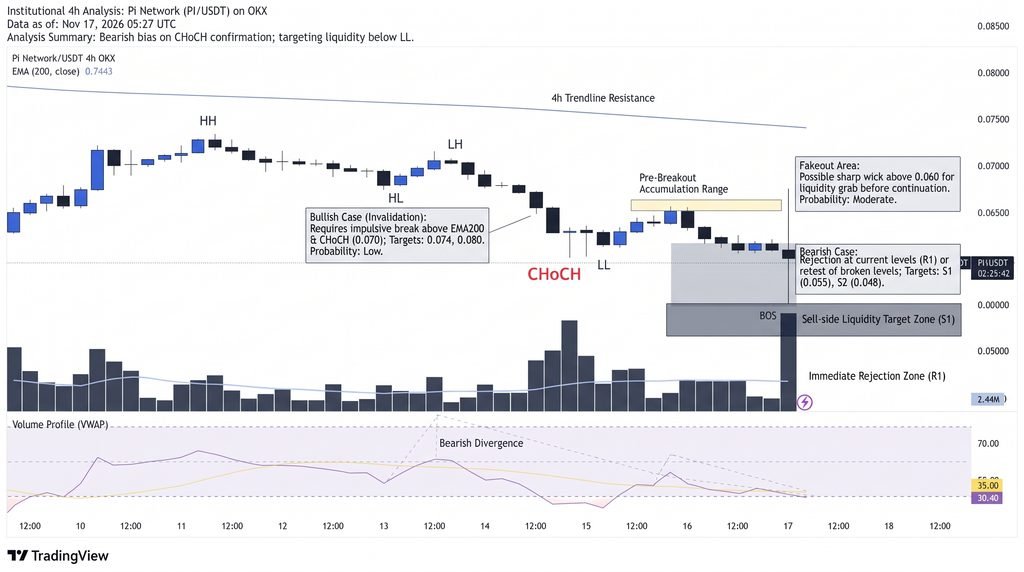
This positioning indicates that short-, medium- and long-term trends remain bearish. The Relative Strength Index (RSI) near 26 signals oversold conditions, while the Moving Average Convergence Divergence (MACD) remains below zero, confirming negative momentum.
Key technical levels include:
- Immediate resistance: $0.0746.
- 50-day EMA: $0.0763.
- 100-day EMA: $0.0850.
- Additional resistance: $0.0975.
- 200-day EMA: $0.1083.
A recovery above $0.0746 could provide the first indication of improving buying interest. However, PI would need to reclaim its major moving averages to challenge the broader bearish structure.
Conclusion
Pi Network remains vulnerable as negative funding, a declining Sharpe Ratio and bearish technical indicators reinforce selling pressure. Although the RSI near 26 leaves room for a short-term relief rally, oversold conditions do not guarantee a reversal. A sustained move above $0.0746 would be an important initial recovery signal, while the $0.0551 low remains a critical downside reference.
Sources & Methodology
Primary-source standard: Market-moving facts should link to original data releases, regulator notices, company filings or official project announcements whenever available. Secondary reporting is used for additional context, not as a substitute for original evidence.
Page last reviewed: