
Dogecoin is back in the spotlight after a 5.7% surge, bouncing off a key support level and fueling fresh optimism in the market. With momentum building, analysts are eyeing a potential breakout—one that could send DOGE soaring toward $3.
At the core of this bullish outlook is Dogecoin’s price action, which is currently consolidating within a critical range. If support holds, a push toward the upper resistance could pave the way for a stronger rally.
But the real kicker? The Stochastic RSI is flashing a signal that has historically preceded massive price moves. The last two bullish crossovers—October 2023 and February 2024—led to 88% and 187% price surges, respectively. Now, we’re seeing the same setup again, hinting at a potential breakout.
Key Technical Levels to Watch:
- Support holding above: $0.17
- Stochastic RSI crossover: Historically linked to major breakouts
- Upside target: $3 if momentum holds
Dogecoin Network Sees Massive Growth
Beyond the charts, Dogecoin’s fundamentals are strengthening. On-chain data shows a surge in new users, with active DOGE addresses doubling from 16,400 to 34,600 in just a month.
This points to rising adoption and growing investor confidence.
Other standout metrics include:
- $7.24 million in 24-hour liquidations, signaling heightened trading activity
- DOGE futures open interest up 4%, now at $1.4 billion
- Institutional interest rising, with Bitwise reportedly exploring a Dogecoin ETF
These factors suggest DOGE isn’t just riding a short-term wave—it’s gaining long-term traction.
Bullish Pattern Signals Meme Coin Rally
Veteran trader Tardigrade has identified a recurring pattern in Dogecoin’s cycles. Historically, DOGE forms a double-bottom structure before breaking out. Right now, the same setup is in play, aligning with past pre-rally phases.
With bullish technicals, network expansion, and institutional backing coming together, Dogecoin may be on the verge of a major breakout. If momentum holds, $3 could be within reach in the coming months.
For now, DOGE is trading at $0.172, with market momentum ticking higher. The question is—will this be the next big meme coin rally? Traders will be watching closely.
Dogecoin (DOGE) Price Analysis – 2H Chart
Dogecoin is currently consolidating within a symmetrical triangle pattern on the 2-hour chart, indicating an imminent breakout. The price is struggling against a descending trendline, with the 50-period EMA (0.17123) acting as dynamic resistance.
A breakout above this level could signal bullish momentum, potentially targeting $0.18129 and $0.19604. Conversely, failure to break above resistance may lead to a bearish rejection, with key support levels at $0.16502, $0.15294, and $0.14271.
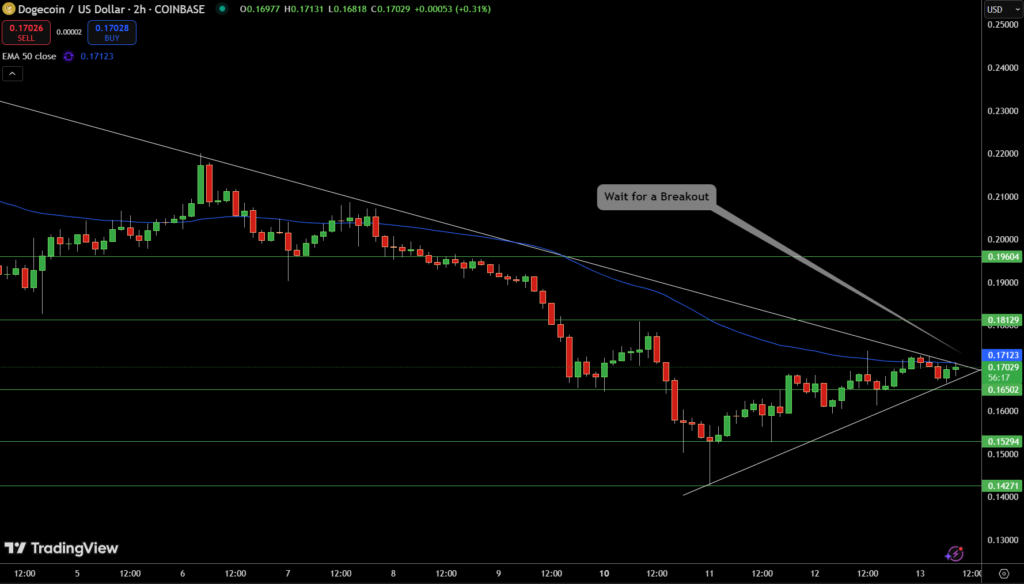
With decreasing volatility and tightening price action, traders should watch for a decisive move beyond the trendline before entering positions. A breakout with strong volume could confirm direction, while a fakeout remains a risk. The RSI and volume trends should be monitored for confirmation.
Overall, DOGE is at a critical juncture, and the next move could define its short-term trend. Caution and breakout confirmation are key before taking action.