
The Australian Dollar is holding close to 0.6948 against the US Dollar in early European trading Thursday, leaving AUD/USD within striking distance of a key Fibonacci support level. The pair is approaching the 78.6% retracement at 0.6947, while its broader daily structure remains bearish. The Australian currency has shown relative strength against several major counterparts, but the U.S. dollar remains a tougher hurdle. Meanwhile, the Reserve Bank of Australia has lifted its cash rate to 4.60%, adding to the policy backdrop facing the pair.
RBA Rate Hits 4.60% as AUD Trades
The RBA raised its Official Cash Rate by 25 basis points to 4.60% at its Sept. 29 meeting. The decision was unanimous, with the central bank citing persistent inflation pressures, higher global energy prices and domestic capacity constraints. At the same time, the RBA acknowledged slower output growth, easing labor-market conditions and softer housing conditions.
The central bank kept the possibility of another increase open, saying it would respond to incoming data and changes in the economic outlook. Governor Michele Bullock also emphasized that monetary policy works with a lag, leaving the future path dependent on inflation and economic conditions.
Australia’s latest trade figures provide another consideration for the Australian Dollar. The August trade surplus narrowed sharply to A$495 million, from A$1.351 billion in the previous reading cited in the source material.
The next major U.S. catalyst is the ISM Manufacturing PMI. The Institute for Supply Management scheduled its September 2026 manufacturing report for 10:00 a.m. ET on Oct. 1, making the release a potential source of volatility for the U.S. Dollar and AUD/USD.
AUD/USD Tests 0.6947 Fibonacci Support
AUD/USD trades around 0.6948, just above the 78.6% Fibonacci retracement at 0.6947. The pair remains below its 20-period EMA at 0.7063, while the 61.8% Fibonacci level at 0.7010 creates an additional resistance barrier.
The Relative Strength Index (RSI) is around 27.6, placing it in oversold territory. That reading signals strong downside momentum, although it can also indicate that the pace of the decline may moderate if sellers lose momentum.
The main technical levels are:
- 78.6% Fibonacci: 0.6947
- 100% Fibonacci: 0.6867
- 61.8% resistance: 0.7010
- 50% resistance: 0.7054
- 20-period EMA: 0.7063
A sustained move below 0.6947 would expose the 0.6867 level, representing the 100% Fibonacci anchor. Conversely, a recovery above 0.7010 would put 0.7054 and the 20-period EMA at 0.7063 back into focus.
Key AUD/USD Resistance Levels Ahead
Beyond 0.7063, AUD/USD faces further resistance at the 38.2% Fibonacci retracement near 0.7097 and the 23.6% level at 0.7152. The cycle-high area around 0.7240 represents the upper boundary of the current Fibonacci structure.
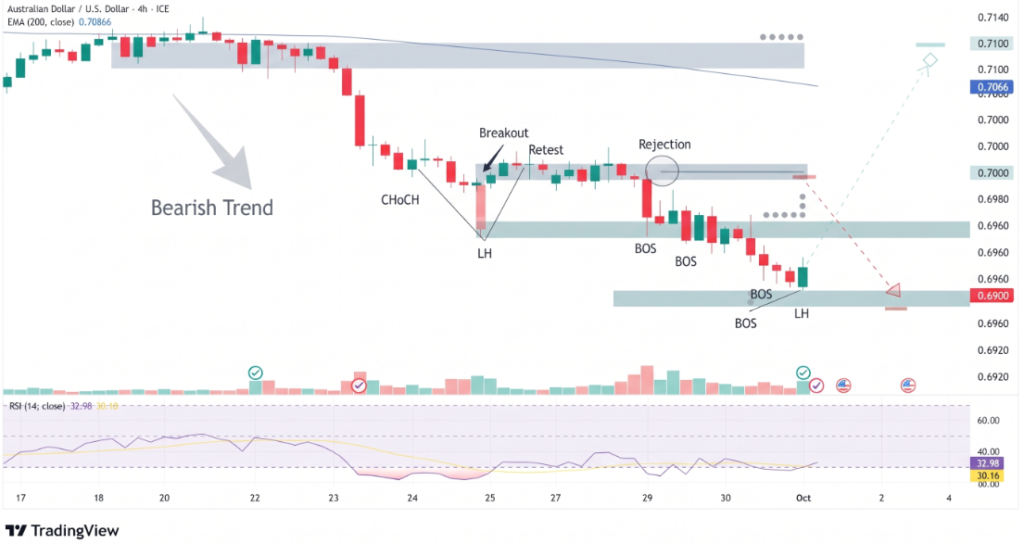
The technical setup therefore leaves AUD/USD at an important decision point. The 0.6947 level is the immediate test for sellers, while the oversold RSI introduces the possibility of a short-term stabilization without confirming a broader reversal.
Conclusion
AUD/USD is approaching a technically important level near 0.6950 as the pair trades close to its 78.6% Fibonacci retracement at 0.6947. The RBA’s move to 4.60% provides a restrictive Australian rate backdrop, but the currency remains exposed to U.S. Dollar movements and incoming U.S. economic data. A break below 0.6947 would bring 0.6867 into focus, while a recovery above 0.7010 could open the path toward 0.7054 and 0.7063.
Sources & Methodology
Primary-source standard: Market-moving facts should link to original data releases, regulator notices, company filings or official project announcements whenever available. Secondary reporting is used for additional context, not as a substitute for original evidence.
Page last reviewed: