The US Dollar Index (DXY) is easing modestly near 101.28 on Wednesday but remains close to its two-month high of 101.64. The index, which measures the US Dollar against six major currencies, is being pulled between strong recent momentum and reduced expectations for an immediate Federal Reserve rate increase. Traders are now turning to US employment and inflation data for fresh clues about the Fed’s next policy decision. The August PCE Price Index is scheduled for release at 8:30 a.m. Eastern time on September 30.
Fed Rate Bets Shift After Williams
The dollar’s latest pause follows comments from New York Fed President John Williams, who said there was no urgency for another rate increase after the September decision. Williams emphasized that additional economic data would help determine the next policy move. Reuters reported that he still sees the possibility of one further hike this year if inflation remains persistent.
The change in expectations has been visible in interest-rate markets. The probability of an October rate increase cited by FXStreet fell to 44.8% from 70.9% earlier in the week. Other market measures also showed the odds falling sharply after Williams’ comments.
The Federal Reserve raised its federal-funds target range to 3.75%-4.00% at its September meeting. Inflation remains above the Fed’s 2% objective, keeping upcoming data particularly important for the policy outlook.
The main releases include:
- ADP September employment: forecast at 70,000 jobs
- August core PCE: expected around 3.3% YoY
- August PCE: previous reading was 3.7% YoY
- October Fed hike odds: recently around 45%
The Bureau of Economic Analysis confirms that July core PCE was 3.3% year over year, while headline PCE increased 3.7%. The August figures are due on September 30.
DXY Technical Levels in Focus
On the daily chart, DXY trades at 101.28, remaining above its 20-day exponential moving average at 100.40. That leaves the index above a key short-term trend reference despite Wednesday’s modest decline.
The Relative Strength Index (RSI) is around 68.70, close to the commonly watched 70 threshold for overbought conditions. The reading shows strong recent momentum but also indicates that the advance has become stretched.
The key technical levels are:
- 101.80: Yearly high and major resistance
- 101.64: Recent two-month high
- 101.28: Current reference price
- 101.00: Immediate support
- 100.40: 20-day EMA support
101.80 Breakout Depends on Data
A sustained move above 101.80 would take DXY beyond its current yearly high and establish a new technical reference for the index. However, the upcoming US data could determine whether buyers have enough momentum to challenge that level.
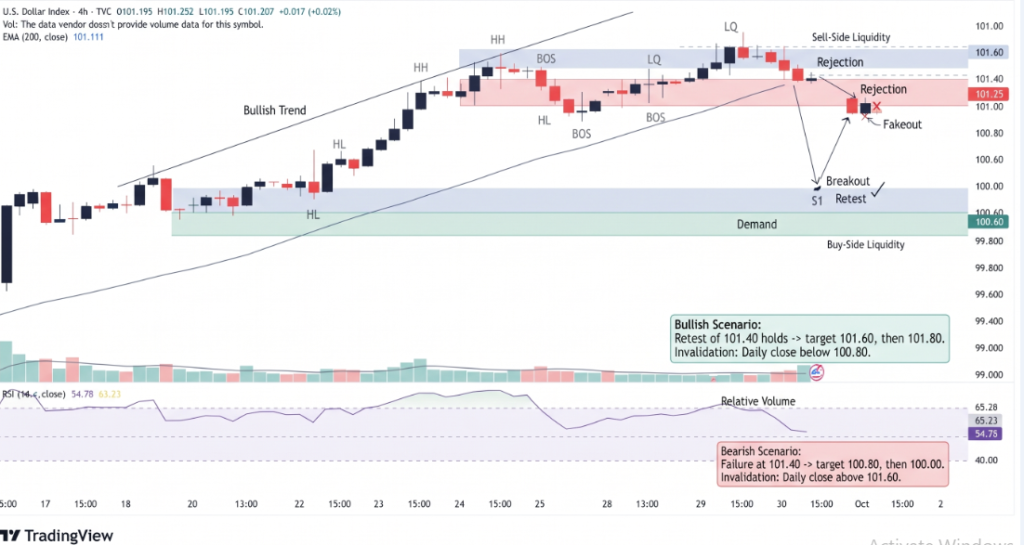
A stronger-than-expected employment or inflation reading could alter market expectations for Federal Reserve policy, while softer figures could reinforce the recent reduction in near-term rate-hike expectations.
The JOLTS report has already provided a softer labor-market signal. August US job openings fell to 7.08 million, according to market reports, adding to evidence that employment conditions are losing some momentum.
Conclusion
DXY remains near 101.28 after reaching a two-month high, but the market is reassessing the timing of the next Fed rate hike. Technically, 101.80 is the key upside barrier, while 101.00 and the 100.40 20-day EMA provide the main downside references. With August PCE data and employment figures due, the next major move in the dollar will depend heavily on whether incoming US data change current interest-rate expectations.
Sources & Methodology
Primary-source standard: Market-moving facts should link to original data releases, regulator notices, company filings or official project announcements whenever available. Secondary reporting is used for additional context, not as a substitute for original evidence.
Page last reviewed: