
Pi Network is trading around $0.0918, putting PI directly at its 50-day Exponential Moving Average (EMA) near $0.0917. The move extends the token’s modest recovery after PI closed at about $0.0909 on September 29. Market positioning is also showing increased activity, while broader cryptocurrency sentiment remains in the greed zone.
The immediate technical question is whether PI can establish a sustained move above the 50-day EMA. A confirmed break would bring the $0.0990-$0.1002 resistance area into focus, while rejection could send the token back toward lower Fibonacci support.
PI Futures Activity Picks Up
The recovery is developing alongside stronger derivatives positioning. According to the supplied market data, PI futures Open Interest increased to $10.57 million from $10.05 million in one day. Open Interest measures the notional value of outstanding futures contracts, so an increase indicates that more positions are being maintained in the derivatives market.
Broader crypto market sentiment is also supportive of risk-taking. CoinMarketCap currently shows its Crypto Fear and Greed Index at 67, classified as greed. However, sentiment alone does not establish a price trend, and the index has declined from higher recent levels.
Pi Network has also continued development work. The project has announced new developer capabilities, including local storage for selected Pi Browser apps and expanded documentation. The network has also continued work related to KYC and Mainnet migration.
$0.0917 EMA Becomes Key Resistance
PI is testing the 50-day EMA at $0.0917, but the broader daily structure remains constrained by higher moving averages. The 100-day EMA near $0.1002 and 200-day EMA around $0.1235 remain above the market, leaving significant resistance between the current price and the longer-term trend indicators.
The key technical levels are:
- $0.0917: 50-day EMA and immediate breakout level
- $0.0990: 50% Fibonacci retracement
- $0.1002: 100-day EMA
- $0.0827: 23.6% Fibonacci support
- $0.0801: July 31 low
The $0.0990-$0.1002 region is particularly important because the 50% Fibonacci retracement and 100-day EMA form a closely positioned resistance cluster.
Momentum has improved but remains mixed. The daily Relative Strength Index (RSI) is around 52, slightly above the neutral 50 mark. Meanwhile, the MACD remains below zero but is positioned marginally above its signal line, indicating that downside momentum has eased without confirming a full trend reversal.
$0.0827 Support Defines Downside Risk
A rejection from the 50-day EMA would put the recent recovery under pressure. The first major downside reference is the $0.0827 Fibonacci level, which is reinforced by the July 31 low near $0.0801.
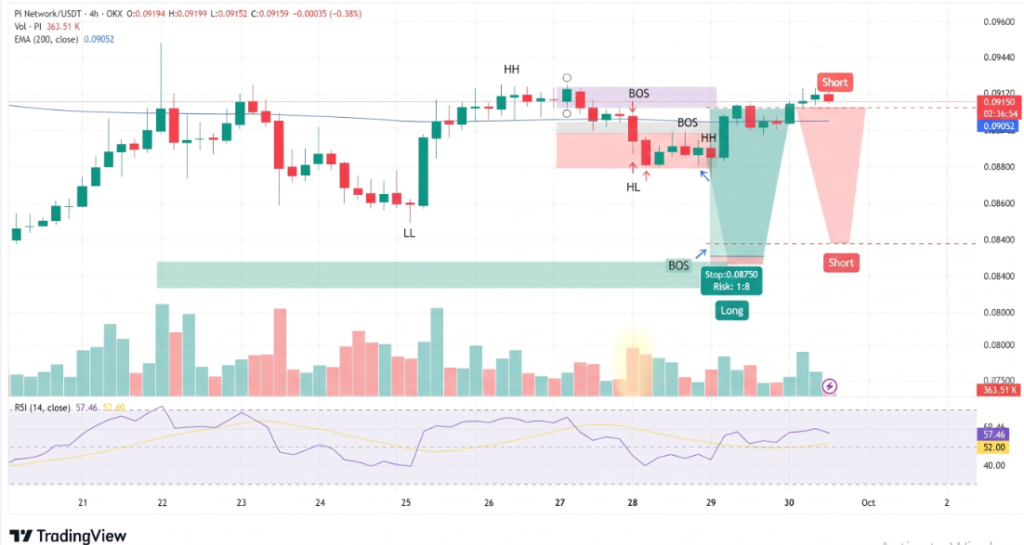
PI’s recent price history shows why this area matters. The token fell to around $0.0822 on September 17 before recovering toward $0.0918 by September 30.
A sustained move above $0.0917 would place $0.0990 and $0.1002 on the chart as the next resistance area. Conversely, a failure to hold the 50-day EMA followed by a break below $0.0827 would weaken the recovery structure and expose $0.0801.
A deeper decline could eventually bring the $0.0704 all-time low into focus, although that would require a much larger breakdown from current levels.
Conclusion
Pi Network is trading near $0.0918, placing PI directly above its $0.0917 50-day EMA. The technical setup is improving, but the token still faces significant resistance at $0.0990-$0.1002, where the 50% Fibonacci retracement meets the 100-day EMA. RSI near 52 and a recovering MACD show improving momentum without confirming a broader trend reversal. Holding above $0.0917 would keep the recovery structure intact, while a rejection could return attention to $0.0827 and $0.0801.
Sources & Methodology
Primary-source standard: Market-moving facts should link to original data releases, regulator notices, company filings or official project announcements whenever available. Secondary reporting is used for additional context, not as a substitute for original evidence.
Page last reviewed: