
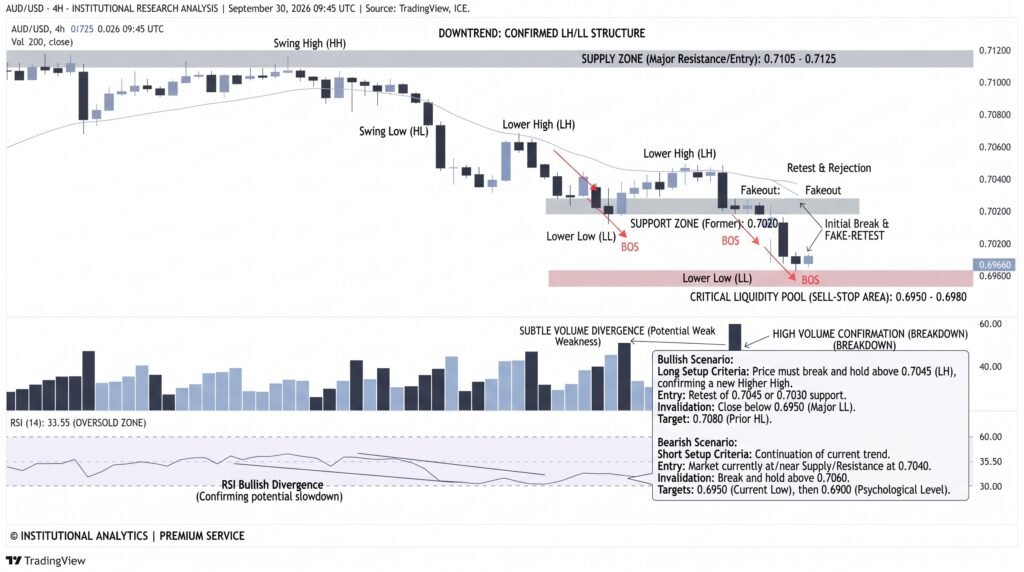
The Australian Dollar is attempting a modest recovery against the US Dollar, rising toward 0.6972 after touching 0.6960 during Wednesday’s European session. The pair remains below Tuesday’s 0.6985 close, keeping short-term pressure intact. Australia’s August inflation data showed headline CPI accelerating to 4.0% year over year from 3.5% in July, while monthly CPI increased 0.4% in original terms.
Australian Inflation Keeps RBA Focused
The latest inflation report reinforces the Reserve Bank of Australia’s concern that price pressures remain above its target range. The closely watched trimmed-mean measure was unchanged at 3.6% in August, remaining well above the RBA’s 2%-3% inflation target.
The RBA raised its cash-rate target by 25 basis points to 4.60% on September 29, marking its fourth increase of 2026. Governor Michele Bullock said higher rates were needed to ensure inflation returns to target and warned that upside inflation risks were materializing.
Key policy considerations include:
- Cash rate: 4.60%
- August headline CPI: 4.0% YoY
- August monthly CPI: 0.4%
- August trimmed mean: 3.6%
The Australian Dollar initially weakened after the inflation release as the headline figure came in slightly below the 4.1% median forecast cited by Reuters, while November rate-hike expectations also eased.
AUD/USD Technical Levels Under Pressure
On the daily chart, AUD/USD trades around 0.6977, below its 20-day exponential moving average at 0.7078. The pair has also slipped beneath the 61.8% Fibonacci retracement at 0.7008, keeping the near-term technical structure bearish.
The 14-day Relative Strength Index is around 29, indicating oversold conditions. That could limit immediate downside momentum, although the oscillator alone does not reverse the broader trend while price remains below key moving-average and Fibonacci resistance.
Resistance levels to monitor are:
- 0.7008: 61.8% Fibonacci retracement
- 0.7052: 50% retracement
- 0.7078: 20-day EMA
- 0.7096–0.7150: Higher Fibonacci barriers
0.6946 Support Defines Next Move
On the downside, 0.6946 represents the initial technical support near the 78.6% Fibonacci retracement. A sustained break below that level would expose the 0.6866 swing-low region, corresponding to the 100% retracement.
Meanwhile, US inflation data remain important for the second half of the session. The US Bureau of Economic Analysis scheduled the August Personal Consumption Expenditures report for September 30 at 8:30 a.m. Eastern time, or 12:30 GMT.
Conclusion
AUD/USD is attempting to stabilize after testing 0.6960, but the pair remains below 0.7008 and its 20-day EMA at 0.7078. Australia’s 4% annual CPI keeps inflation at the center of the RBA’s policy debate, while the upcoming US PCE figures could influence the dollar side of the equation. A recovery above 0.7008 would improve the short-term technical picture, while a break below 0.6946 would put 0.6866 back into focus.
Sources & Methodology
Primary-source standard: Market-moving facts should link to original data releases, regulator notices, company filings or official project announcements whenever available. Secondary reporting is used for additional context, not as a substitute for original evidence.
Page last reviewed: