
Brent oil is consolidating near $98.59 on the supplied 5-hour chart after a sharp move lower, leaving the market between the 200-period SMA at $95.43 and resistance around the 50-period SMA at $101.08. The broader oil market remains sensitive to supply developments in the Gulf. Reuters reported Brent near $98.67 on Oct. 1, while the contract gained about 14% in September as Middle East supply disruptions remained a central market issue.
Brent Oil Holds Key Technical Range
The 5-hour setup places Brent in a narrow technical band, with $95 acting as the lower boundary and the $102.30 area marking major resistance. The current price sits between those levels, creating a zone where short-term signals can conflict.
The 200-period SMA near $95.43 is the key reference for buyers. Holding above that average would keep the lower part of the range intact, while a sustained break below it would weaken the near-term structure. At the other end, the 50-period SMA at $101.08 overlaps with the upper resistance area, increasing the importance of the $101-$102.30 zone.
The Ichimoku Cloud top and SuperTrend are both positioned near $102.30 in the supplied chart. That convergence makes the level important for confirmation rather than relying on a single indicator.
Brent Support and Resistance Levels
Brent’s next major move could depend on which side of the current range breaks first. The technical framework supplied for the chart identifies $95.13 as an important downside invalidation level and $102.30 as the key upside threshold.
- $95.43: 200-SMA support.
- $101.08: 50-SMA resistance.
- $102.30: SuperTrend and Ichimoku resistance.
- $85.90: Extended downside reference if bearish momentum accelerates.
A sustained move above $102.30 would place greater emphasis on improving momentum and trading volume. A failure near $101-$102.30 followed by a break below the 200-SMA would instead expose lower support. The chart’s ATR reading of 1.83 also shows that daily swings remain large enough to produce sharp moves around these boundaries.
Gulf Supply Risks Keep Brent Volatile
Technical signals are developing against a changing fundamental backdrop. Reuters reported that Gulf crude exports were recovering, helping ease some supply pressure, while Saudi Arabia resumed exports through Yanbu and its East-West Pipeline. U.S. crude inventories also unexpectedly increased by 922,000 barrels to 427.3 million barrels, adding another factor limiting near-term supply concerns.
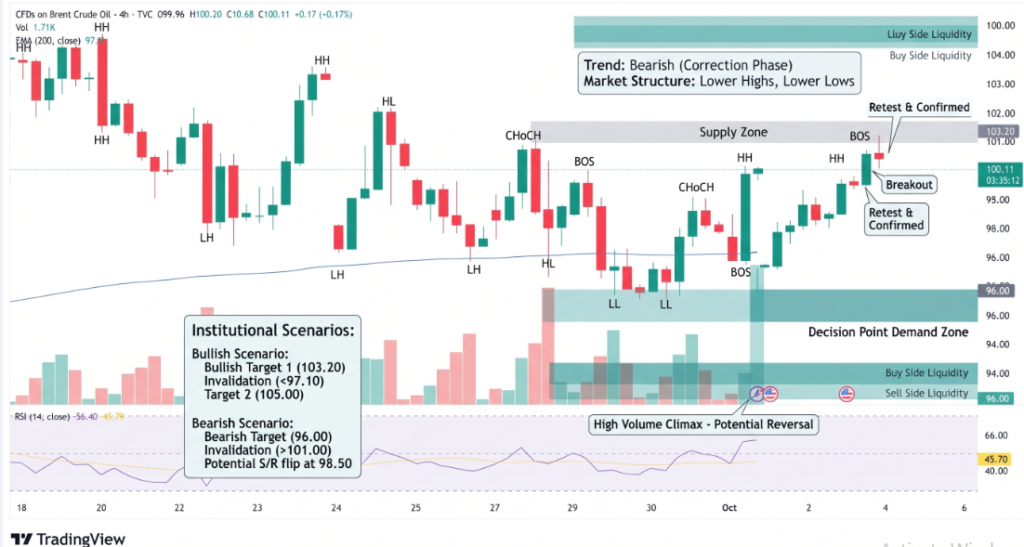
UKOIL Price Chart – Source: Tradingview
At the same time, oil markets remain highly sensitive to developments involving the Strait of Hormuz and U.S.-Iran diplomacy. A continued recovery in shipments could weigh on Brent’s risk premium, while renewed disruption could quickly push prices back toward the upper end of the range.
Conclusion
Brent remains compressed near $98.59, with $95.43 and $102.30 defining the most important technical boundaries on the supplied 5-hour chart. The 200-SMA is the primary downside reference, while the 50-SMA, SuperTrend and Ichimoku resistance converge near the upper boundary. Until Brent breaks decisively outside the range, the combination of weak trend direction and elevated geopolitical sensitivity leaves the market vulnerable to rapid reversals.
Sources & Methodology
Primary-source standard: Market-moving facts should link to original data releases, regulator notices, company filings or official project announcements whenever available. Secondary reporting is used for additional context, not as a substitute for original evidence.
Page last reviewed: