Natural Gas is testing a key technical support zone around $2.97-$3.00, with the five-hour chart showing price near $3.024. The area combines the 50-period simple moving average, SuperTrend and 50% Fibonacci retracement, creating a concentrated support band. A Doji near this zone signals uncertainty between buyers and sellers. The setup comes as U.S. natural-gas prices approach the $3-per-million-Btu threshold, with weather, production and storage remaining important market drivers.
$2.97 Support Faces Key Test
The $2.97-$3.00 area is the immediate technical battleground. The supplied five-hour setup places the 50-SMA, SuperTrend and 50% Fibonacci retracement close together, making the zone important for determining whether the recent decline can stabilize.
A Doji forms when the opening and closing prices are close together relative to the session’s range. On its own, the pattern does not confirm a reversal. Its significance increases when it appears directly at established support, as it does in this setup.
Fundamentally, the market remains sensitive to the balance between U.S. production, consumption, exports and inventories. The Energy Information Administration reported that Henry Hub spot prices averaged $2.93 per million British thermal units from June through August 2026, 6% below the same period a year earlier. Strong production and ample inventories helped limit upward pressure despite exceptionally hot summer weather.
The main technical levels are:
- $2.97-$3.00: Major support confluence
- $3.12: Initial breakout resistance
- $2.93: Technical invalidation area
- $2.87: Approximate 200-SMA target
Doji Signals Market Indecision
The five-hour Doji highlights the lack of conviction near $3.00. Buyers have managed to defend the support zone, but sellers remain active below the next resistance at $3.12. This leaves the market vulnerable to false moves until price escapes the current range.
The broader chart also contains a potential double-top structure near $3.317. That formation followed the previous advance and raises the possibility that the market is undergoing a deeper correction rather than simply consolidating before another immediate rise.
The $3.00-$3.11 area can therefore become a congestion zone. The 50-SMA provides support underneath price, while the 20-SMA acts as an overhead constraint in the supplied setup. Momentum confirmation from the MACD and trading volume would provide additional evidence for either direction.
$3.12 Break Could Shift Momentum
A five-hour close above $3.12 would be the first significant technical improvement. Such a move would take price above the immediate resistance barrier and could expose the $3.18 region before the market confronts higher levels.
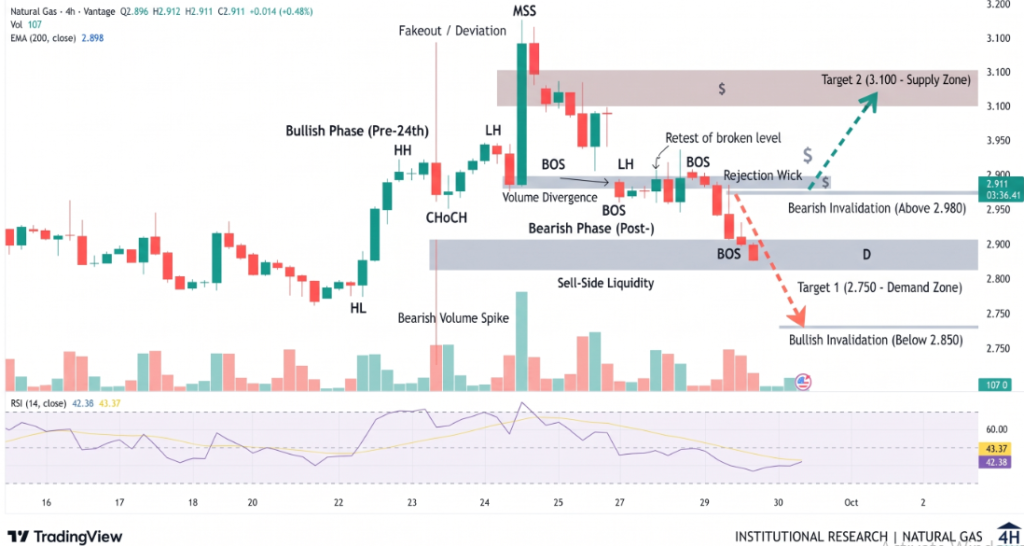
By contrast, a five-hour close below $2.97 would weaken the support structure. The next area of interest would then be around $2.93, followed by the 200-period SMA near $2.87 in the supplied chart.
Fundamental data will remain relevant alongside the technical picture. The EIA publishes its Weekly Natural Gas Storage Report each Thursday, providing the market with a regular gauge of U.S. underground inventories.
Recent inventory data have shown a sizable supply cushion. For the week ended September 24, U.S. working gas inventories increased 53 billion cubic feet to 3,351 Bcf, leaving stocks 95 Bcf above the five-year average.
Conclusion
Natural gas is holding near $3.02 while the $2.97-$3.00 support cluster faces a decisive test. The Doji signals indecision rather than confirming a reversal, so the next five-hour closes could provide the clearest direction. A break above $3.12 would strengthen the recovery structure and bring $3.18 into focus, while a move below $2.97 would expose $2.93 and potentially the $2.87 200-SMA. Storage, production and weather conditions remain important alongside these technical levels.
Sources & Methodology
Primary-source standard: Market-moving facts should link to original data releases, regulator notices, company filings or official project announcements whenever available. Secondary reporting is used for additional context, not as a substitute for original evidence.
Page last reviewed: