
Natural Gas is trading around $3.129, with bulls and bears struggling to establish control after a sharp advance. The broader structure remains constructive because price is holding well above the 200-period SMA near $2.860 in the supplied five-hour setup. However, momentum has weakened, with the MACD line at 0.0441 below its 0.0538 signal line.
The latest setup points to a market approaching a decisive technical zone. A move above $3.160 could restore short-term bullish momentum, while a break below $3.120 would increase the risk of a deeper pullback.
Current market data also keeps Natural Gas near the $3.13 area, while the latest technical snapshot shows the commodity above its 200-period moving average and its MACD in sell territory.
MACD Warns as Rally Loses Momentum
The recent Natural Gas rally pushed prices substantially above the long-term moving average, reinforcing the broader bullish structure. But the consolidation that followed suggests buyers are becoming less aggressive near the upper end of the recent range.
The MACD bearish cross is the clearest warning. Price has also slipped below the Tenkan-sen at $3.157, adding to the short-term downside signal. Still, the SuperTrend remains positive above $2.977, meaning the larger trend has not yet been technically broken.
The supplied ADX reading of 42.79 indicates a strong underlying trend, although declining volume and the MACD reversal suggest that traders should expect a potentially sharp directional move rather than continued quiet consolidation.
- Bullish trigger: sustained close above $3.160
- Bearish trigger: break below $3.120
- Major support: $3.050
- Major resistance: $3.234
$3.050 Support Defines the Setup
The $3.050 area is particularly important because it combines the 38.2% Fibonacci retracement with the Kijun-sen. A confirmed rebound there would keep the broader bullish structure intact and could put $3.160 and then $3.234 back into focus.
Conversely, a sustained break below $3.120 would expose $3.050. If that support fails, the bearish case strengthens and the $2.977 SuperTrend level becomes the next major structural test.
The ATR of 0.0631, or roughly 2.01%, also highlights elevated volatility. That means individual five-hour candles can produce moves of roughly six cents or more, increasing the risk of false breakouts around the current range.
Breakout or Breakdown Ahead?
Natural Gas remains inside a narrow technical battle zone between approximately $3.100 and $3.230. The developing bull flag structure favors continuation if buyers regain control, but the bearish MACD cross shows that the previous rally is losing momentum.
A move through $3.234 would challenge the recent resistance structure and could open the way toward the $3.317 invalidation level for the bearish setup. A failure below $3.120, meanwhile, would shift attention toward $3.050 and potentially $2.977.
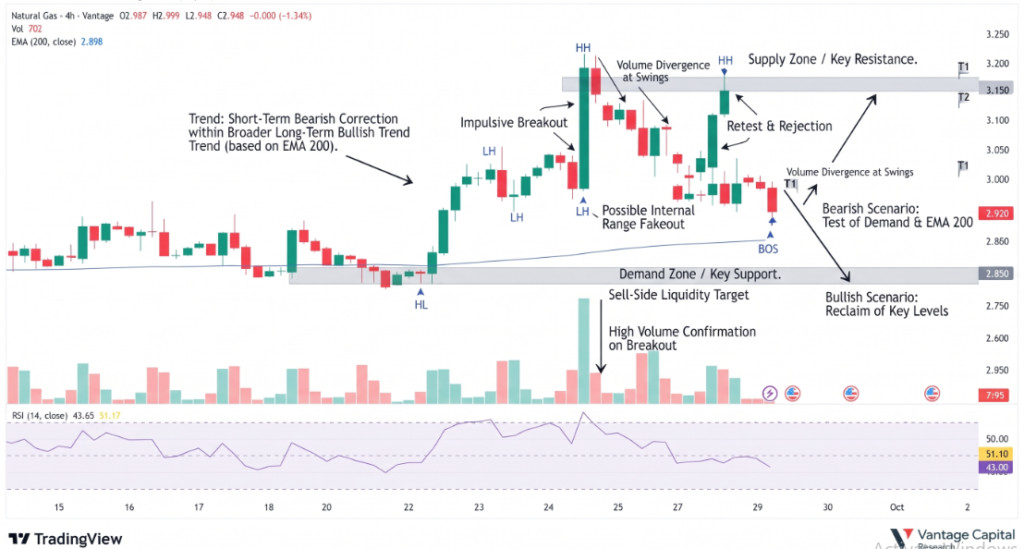
Key levels to watch
- $3.160: Tenkan-sen recovery level
- $3.050: Fibonacci and Kijun-sen support
- $3.234: Breakout resistance
- $2.977: Bullish structure invalidation
- $3.317: Bearish setup invalidation
Conclusion
Natural Gas remains technically bullish on the broader structure, but the $3.129 price is sitting at a critical decision point. The bearish MACD cross and fading volume warn that the recent rally is losing momentum, while support above the $3.050-$2.977 region keeps the larger bullish structure alive. A break above $3.234 would strengthen the continuation case, while a sustained move below $3.120 would increase downside risk.
Sources & Methodology
Primary-source standard: Market-moving facts should link to original data releases, regulator notices, company filings or official project announcements whenever available. Secondary reporting is used for additional context, not as a substitute for original evidence.
Page last reviewed: