
Natural Gas is consolidating after a sharp rally, with the five-hour chart showing price around $3.121 inside a defined $3.081-$3.203 range. Recent futures data confirms the market has pulled back sharply after reaching $3.395 on Sept. 24, while the Sept. 28 contract was trading near $3.12.
The immediate technical question is whether buyers can defend $3.081 or sellers can force a break below it. Above the range, $3.203 is the first major resistance, while a move through that level could reopen the path toward $3.276.
Natural Gas Enters a Consolidation Phase
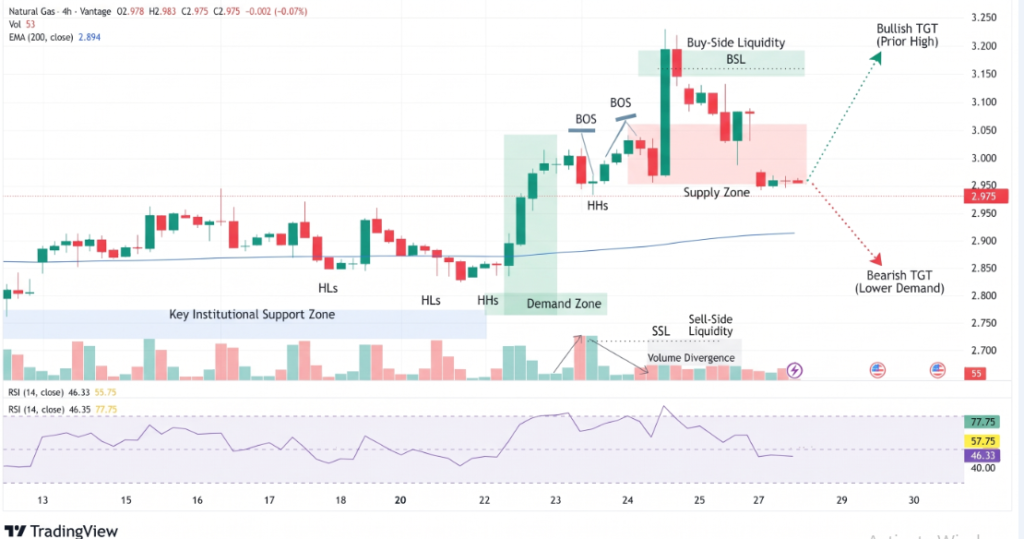
The five-hour setup shows a market digesting a powerful advance. Price remains above the longer-term 200-period moving average, which is around $2.85 in the supplied chart, keeping the broader structure constructive despite the recent pullback.
However, short-term momentum has weakened. The latest technical data shows the 200-period moving average around $2.97 on the current futures contract, while the 20- and 50-period averages are near $3.14. That leaves Natural Gas below several shorter-term averages but still above the longer-term trend measure.
The market is also sitting close to the Ichimoku Cloud, making the $3.081-$3.203 area important for determining the next directional move.
- Current reference price: $3.121
- Primary support: $3.081
- Primary resistance: $3.203
- Long-term trend support: around $2.85-$2.97
$3.081 Support Faces the Next Test
The $3.081 support zone is the key downside level in the supplied five-hour setup. It aligns with the 20-period SMA and the 50% Fibonacci retracement, making a confirmed break potentially more significant than an ordinary intraday dip.
If $3.081 fails, the next reference points are $3.035 and $2.969. A decline toward $2.969 would also bring price closer to the longer-term moving-average structure.
Momentum indicators provide mixed signals. The supplied chart shows RSI at 56.38, after retreating from overbought conditions, while MACD has produced a weak bearish crossover. Current futures data similarly shows MACD in negative territory, although RSI is now closer to neutral at roughly 46.
The upside case depends on a sustained break above $3.203. Such a move would clear the upper boundary of the current range and could expose $3.276, the next technical objective from the supplied setup.
Breakout Levels Define the Risk Map
Natural Gas remains vulnerable to whipsaws while it trades between $3.081 and $3.203. Traders watching the setup are likely to focus on confirmation rather than price movement inside the middle of the range.
Fundamentally, U.S. storage also remains relevant as the market approaches winter. The U.S. Energy Information Administration expects working gas inventories to reach 3,969 billion cubic feet by Oct. 31, 2026, about 5% above the 2021-2025 five-year average.
- Support: $3.081, followed by $3.035 and $2.969
- Resistance: $3.203, followed by $3.276
- Range: $3.081-$3.203
- Bullish trigger: Sustained move above $3.203
- Bearish trigger: Confirmed break below $3.081
Conclusion
Natural Gas is caught between $3.081 support and $3.203 resistance after a sharp September advance. The current consolidation reflects weaker short-term momentum, but price remains above the longer-term moving-average structure. A break above $3.203 would strengthen the bullish continuation setup toward $3.276, while a move below $3.081 would expose $3.035 and $2.969. Until either boundary breaks decisively, the range remains the clearest technical guide for XNG/USD.
Sources & Methodology
Primary-source standard: Market-moving facts should link to original data releases, regulator notices, company filings or official project announcements whenever available. Secondary reporting is used for additional context, not as a substitute for original evidence.
Page last reviewed: