
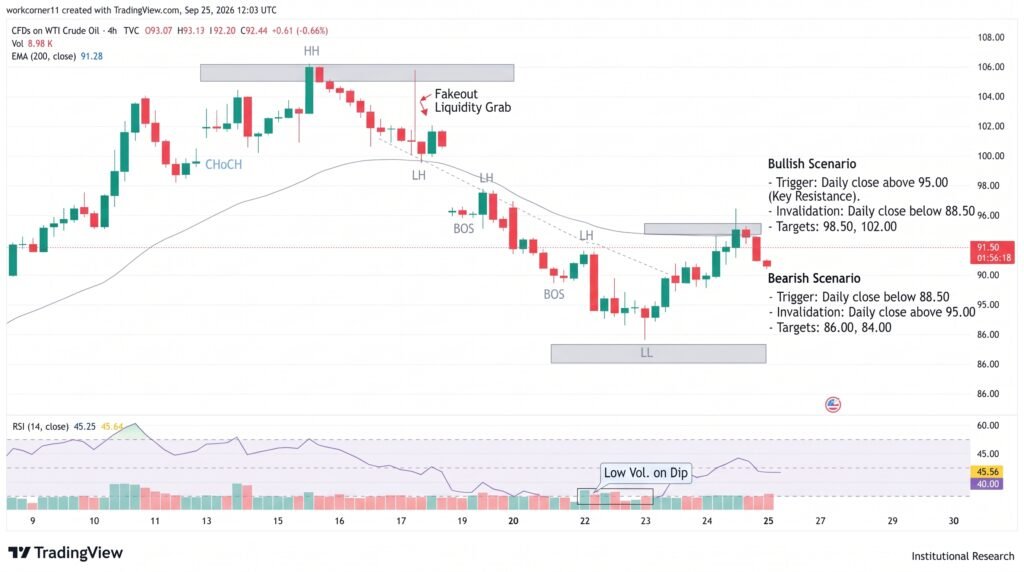
Crude Oil WTI is consolidating around $93.29 on the five-hour chart, caught between support near $92.21 and resistance around $95.94. The narrow range follows a sharp correction that pushed prices below the $100 area earlier in the month.
Recent futures data show WTI settled at about $94.61 on September 24 after rising 2.7%, while prices subsequently retreated toward the $93 area on September 25.
The market remains highly sensitive to geopolitical developments. Reports of possible U.S.-Iran diplomatic progress have reduced some supply-risk premium, while continued attacks involving Saudi Arabia have kept concerns about Middle Eastern production and transportation disruptions elevated.
Technically, the current price sits above the 20-period simple moving average near $92.21 but below the SuperTrend at $95.94. That leaves the market without a confirmed directional breakout.
- Current price: Around $93.29
- 20-period SMA: $92.21
- SuperTrend resistance: $95.94
- 200-period SMA: $88.31
Resistance Keeps Bulls Contained
The broader technical structure presents mixed signals. WTI remains above the 200-period SMA at $88.31, preserving the longer-term upward structure. However, the 50-period SMA around $97.82 is positioned above the market and could reinforce resistance if prices recover.
A sustained move above $95.94 would put the 50-period SMA into focus. A break through $97.82 could then reopen the area around $101.60 and eventually the $106.75 cycle high.
For now, declining volume and overlapping moving averages suggest that traders are waiting for confirmation. The $91.50-$94.00 area can therefore produce choppy price action, particularly while geopolitical headlines continue to influence crude.
The Brent-WTI spread has also widened sharply, reflecting different supply and regional risk dynamics. Reuters reported on September 25 that the spread had reached its widest level since May.
$92.21 Support Defines Next Move
The $92.21 area is the immediate technical line for WTI. It corresponds with the 20-period SMA and sits close to the recent congestion zone. A sustained break below this level would expose the $91.58 Fibonacci reference before the more significant $88.71 swing low.
Conversely, buyers need to reclaim $95.94 to establish stronger short-term momentum. A move above the SuperTrend would bring $97.82 into focus, followed by the broader $101.60-$106.75 resistance area.
WTI’s Average True Range is around $2.05, or roughly 2.2% of the current price. That indicates that daily price swings remain large enough to create substantial volatility even while the five-hour chart is consolidating.
- Primary support: $92.21
- Secondary support: $91.58
- Major support: $88.71
- Resistance: $95.94
- 50-period SMA: $97.82
- Cycle resistance: $101.60-$106.75
- ATR: $2.05
Conclusion
WTI remains trapped near $93.29 between $92.21 support and $95.94 resistance. The longer-term structure is supported by the 200-period SMA at $88.31, but the 50-period SMA near $97.82 continues to limit the recovery. A break below $92.21 would shift attention toward $91.58 and $88.71, while a sustained move above $95.94 could expose $97.82 and higher resistance. Geopolitical developments remain an important catalyst as markets weigh U.S.-Iran diplomacy against continuing Middle Eastern supply risks.
Sources & Methodology
Primary-source standard: Market-moving facts should link to original data releases, regulator notices, company filings or official project announcements whenever available. Secondary reporting is used for additional context, not as a substitute for original evidence.
Page last reviewed: