
Natural Gas is trading around $3.173 on the 5-hour chart after a sharp advance, with the latest move bringing prices close to the recent $3.317 peak. Futures data show the contract jumped 4.76% on September 24, moving from a low near $2.980 to an intraday high of $3.317 before settling around $3.167.
The broader move has strengthened the short-term bullish structure. However, the speed of the advance has also increased the risk of consolidation. Price is now approaching an area where the upper Bollinger Band and recent highs could create resistance.
On the supplied 5-hour setup, Natural Gas remains above the SuperTrend at $2.9772 and the 200-period simple moving average at $2.841.
- Current price: $3.173
- Recent high: $3.317
- SuperTrend: $2.9772
- 200-period SMA: $2.841
Momentum Strong but Stretched
Momentum indicators continue to favor buyers, although they also show that the advance is becoming extended. The MACD line stands at 0.0767 versus a signal line at 0.0568, keeping the momentum indicator in bullish territory.
The Relative Strength Index is around 65.09. That level remains below the traditional 70 overbought threshold, but it indicates that buying pressure has become strong after the recent advance.
The upper Bollinger Band is positioned near $3.267, putting it close to the current market price. A sustained move above that band could signal another attempt at the recent $3.317 high, while rejection could trigger a move toward lower support levels.
The latest futures data also shows how quickly the market has moved. Natural Gas rose from $2.836 on September 21 to $3.173 by September 25, highlighting the strength of the four-session advance.
$3.005 Support Defines Pullback Risk
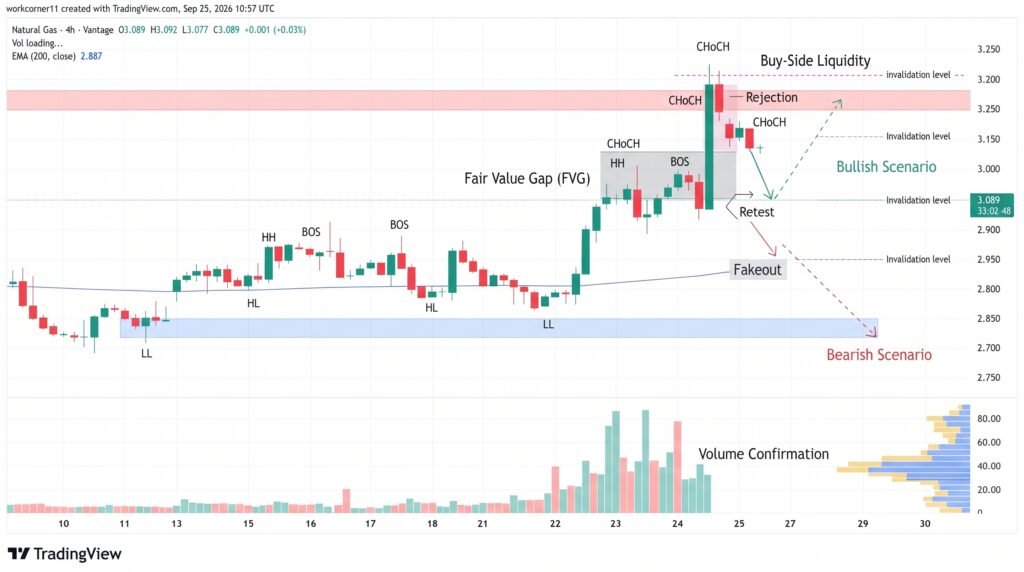
The immediate technical question is whether Natural Gas can hold the recent gains without giving back a meaningful portion of the rally. The $3.005-$3.050 region is important because it combines previous price action with the supplied Fibonacci retracement and moving-average structure.
A break beneath this area would weaken the immediate bullish setup and increase the possibility of a deeper retracement. Conversely, sustained buying above $3.267 could put $3.317 back into focus.
Key levels to monitor include:
- Immediate support: $3.005-$3.050
- Resistance: $3.267-$3.317
- Choppy range: $3.100-$3.200
- Major technical support: $2.9772
- 200-period SMA: $2.841
The $3.100-$3.200 area could remain volatile because it sits between the recent breakout zone and the resistance cluster. Traders watching the trend may therefore look for confirmation rather than assuming that the latest surge will continue without interruption.
Conclusion
Natural Gas remains technically constructive near $3.173 after a sharp multi-session rally, but the move is approaching a resistance zone between $3.267 and $3.317. The bullish structure remains supported by the SuperTrend at $2.9772 and the 200-period SMA at $2.841, while MACD confirms positive momentum. However, RSI near 65 and price near the upper Bollinger Band show that the advance is becoming stretched. A break above $3.317 would strengthen the upside structure, while a retreat below $3.005 could open the way for a deeper pullback.
Sources & Methodology
Primary-source standard: Market-moving facts should link to original data releases, regulator notices, company filings or official project announcements whenever available. Secondary reporting is used for additional context, not as a substitute for original evidence.
Page last reviewed: