
Brent Oil is trading around $98.81 after breaking below the key $101.50 level on the five-hour chart, leaving the benchmark under renewed technical pressure. The breakdown occurred as the market moved through the neckline of a developing head-and-shoulders pattern. At the current level, Brent is approaching the $97.49 50% Fibonacci retracement, making that area the next important test for sellers and buyers.
The break beneath $101.50 has changed the short-term technical structure. That level had acted as a key support area and also represented the neckline of the head-and-shoulders formation identified on the five-hour chart.
Brent’s latest price action confirms that the market has moved below the neckline. The Brent crude technical analysis dashboard shows the benchmark below several short- and medium-term moving averages, keeping the immediate chart structure under pressure.
The immediate technical issue is whether the market can stabilize above the next Fibonacci support or extend the decline.
$97.49 Becomes the Key Test
The $97.49 level combines the 50% Fibonacci retracement with a recent support zone, giving it added importance on the chart. A sustained move below this area would put the $94.20-$94.55 region into focus, where the 61.8% Fibonacci retracement and longer-term moving-average support are located.
Momentum indicators are already weak. The Relative Strength Index (RSI) has moved into oversold territory, while the MACD and several other indicators remain under pressure. An oversold RSI can indicate strong selling momentum, but it can also increase the possibility of a short-term rebound.
Key levels include:
- $97.49: Immediate Fibonacci and price support.
- $94.20-$94.55: Deeper support and potential stabilization zone.
- $101.87-$102.50: Major recovery and resistance area.
$102.50 Caps Any Recovery
A recovery above $101.87-$102.50 would weaken the immediate bearish technical structure. The $102.50 area is particularly important because reclaiming it would place Brent back above the broken neckline region and challenge the recent breakdown.
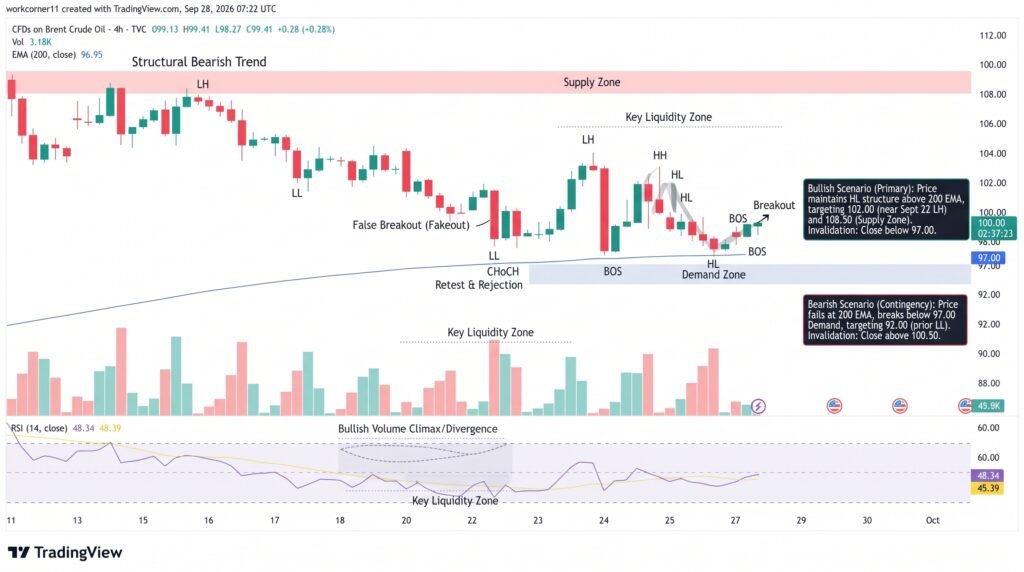
The latest Brent futures price action has remained volatile around the $98-$99 area, highlighting the importance of the nearby support and resistance levels.
For now, the chart remains defined by a lower-price structure, but the proximity of oversold momentum means a rebound cannot be ruled out. Traders are likely to watch whether $97.49 holds before assessing the next directional move.
Conclusion
Brent crude remains below the $101.50 neckline after a decisive technical breakdown, keeping $97.49 as the next major support. A sustained break beneath that level would expose the $94.20-$94.55 region, while a recovery through $101.87-$102.50 would challenge the bearish setup. With momentum indicators showing heavy selling pressure, the next reaction around $97.49 is likely to remain the key technical focus.
Sources & Methodology
Primary-source standard: Market-moving facts should link to original data releases, regulator notices, company filings or official project announcements whenever available. Secondary reporting is used for additional context, not as a substitute for original evidence.
Page last reviewed: