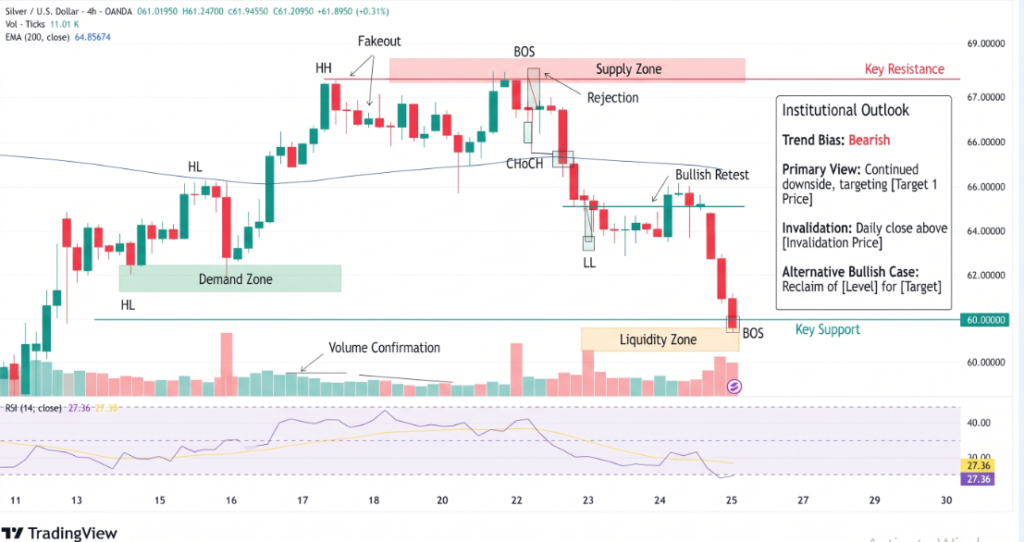
Silver is under renewed selling pressure after breaking below major technical support on its five-hour chart. The metal was trading around $61.56 in the referenced setup, while live market data later showed XAG/USD near $61.08, confirming that sellers remained active on Sept. 28. Silver had closed at $64.30 on Sept. 25, highlighting the scale of the latest decline.
The breakdown has pushed price beneath the 200-period simple moving average (SMA) and the Ichimoku Cloud. Attention is now turning to the $61.18 Fibonacci retracement, followed by $60.00 if selling pressure persists.
Silver Breaks Major Technical Support
The latest move has materially weakened the short-term technical structure. In the referenced five-hour setup, Silver fell through the $65.50 SMA 200, while the Ichimoku Cloud also gave way. A large bearish Marubozu candle accompanied the decline, indicating strong selling pressure during the move.
The broader market backdrop has also become less supportive for precious metals. Recent analysis points to elevated U.S. Treasury yields and a stronger U.S. Dollar Index as important headwinds for Silver. The U.S. 10-year Treasury yield recently climbed above 5%, while the Dollar Index remained above 101, increasing the opportunity cost of holding a non-yielding metal.
Silver’s recent price history reinforces the deterioration. XAG/USD traded above $67 earlier in September and reached a monthly high near $67.52 before retreating sharply.
- Current technical level: $61.56
- 200-period SMA: $65.50
- Fibonacci support: $61.18
- Psychological support: $60.00
$61.18 Becomes the Key Test
The $61.18 Fibonacci retracement is now the immediate level to monitor. A decisive break below it would leave the $60.00 psychological threshold exposed. Below $60, the next major downside reference from the supplied setup is around $55.00.
The Relative Strength Index (RSI) was at 31.36, placing momentum close to traditional oversold territory. However, an oversold RSI alone does not establish that a reversal has begun. Traders typically look for a bullish candle pattern, positive divergence or a successful reclaim of broken support before treating an oversold reading as confirmation.
On the upside, any rebound toward $63.50-$64.50 would test former support that could now act as resistance. A sustained recovery above $65.50 would be more significant because it would place Silver back above the broken 200-period SMA.
Silver Risk Map and Reversal Levels
The technical map remains focused on whether buyers can defend $61.18. If that level holds, Silver could attempt a corrective rebound toward $63.50-$64.50. If it fails, the $60.00 area becomes the next psychological test, followed by the $55.00 region.
- Long-watch zone: $60.00-$61.18, only with reversal confirmation
- Resistance zone: $63.50-$64.50
- Reclaim level: $65.50 SMA 200
- Major downside reference: $55.00
Conclusion
Silver’s technical structure remains under pressure after the break below the $65.50 SMA 200 and Ichimoku Cloud. The immediate focus is $61.18, where a sustained hold could trigger a relief bounce, while a confirmed break could expose $60 and potentially $55. The RSI near 31.36 shows stretched downside momentum, but the broader trend remains vulnerable until XAG/USD reclaims broken resistance and establishes a confirmed reversal.
Sources & Methodology
Primary-source standard: Market-moving facts should link to original data releases, regulator notices, company filings or official project announcements whenever available. Secondary reporting is used for additional context, not as a substitute for original evidence.
Page last reviewed: