
Dogecoin traded near $0.093 on Tuesday after falling 3.84% in the previous session, keeping the meme coin close to its key 200-day exponential moving average (EMA) near $0.092. The level is being watched as a potential technical floor as traders assess renewed demand from U.S. spot Dogecoin ETFs and activity among large holders. Weekly ETF inflows reached $2.89 million through Sept. 25, the strongest weekly inflow since the products launched, although the overall ETF market remains relatively small.
Dogecoin ETFs See Record Inflows
U.S. spot Dogecoin ETFs attracted $2.89 million in net inflows during the week ended Sept. 25, according to SoSoValue data cited by recent market reports. The figure exceeded the previous weekly record of roughly $2.59 million and came after the prior week recorded only $284,510 in net inflows.
The latest inflows provide an additional source of demand for DOGE, but the numbers need context. The capital was concentrated across only three trading sessions, while Grayscale’s Dogecoin product accounted for most of the recent demand. Bitwise has also announced plans to liquidate its Dogecoin fund, with its final trading day scheduled for Oct. 14.
That means the ETF data show renewed interest but do not yet establish broad-based institutional buying.
Other market signals are also mixed. Derivatives positioning has not produced a uniform bullish signal, while positive funding rates indicate that traders holding long positions are paying those on the short side.
Whale Activity Adds Support
Large Dogecoin holders have also remained active during recent price weakness. Recent blockchain-market reports have pointed to accumulation by large wallets, although estimates vary depending on the wallet-size category and measurement period.
The latest price action shows DOGE falling from the $0.098-$0.100 area toward the $0.092-$0.093 region. Data from Dogecoin historical prices show that DOGE closed at $0.093139 on Sept. 28 after reaching an intraday low of $0.091781.
The recent ETF flows and whale activity therefore provide supporting demand signals, but neither guarantees that the decline has ended.
DOGE Tests 200-Day EMA Support
Technically, DOGE is testing the 200-day EMA near $0.092, making that level the first major reference for traders. The 50-day and 100-day EMAs near $0.086 and $0.085 provide deeper moving-average support if selling pressure increases.
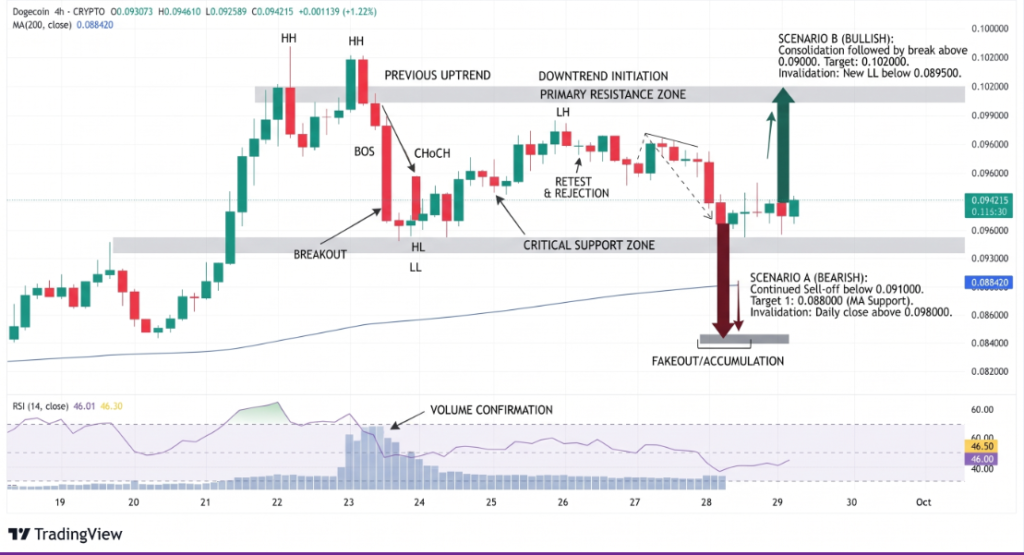
The Relative Strength Index (RSI) around 55 indicates that momentum is neither deeply oversold nor excessively stretched. The MACD remains slightly positive, keeping the technical setup constructive as long as the key support levels hold.
Important levels include:
- Immediate support: $0.092 at the 200-day EMA.
- Secondary support: $0.091 trendline and $0.088 horizontal level.
- Deeper support: $0.086-$0.085 moving-average zone.
- Key resistance: $0.102, where a daily close could strengthen the recovery setup.
A sustained move below $0.092 would expose the $0.091 and $0.088 areas, followed by the $0.086-$0.085 zone. On the upside, a daily close above $0.102 would put the recent recovery back into focus.
Conclusion
Dogecoin is testing the $0.092 200-day EMA after retreating from the $0.098-$0.100 area. Record weekly spot ETF inflows of $2.89 million and evidence of large-holder activity provide supportive signals, but the relatively small and concentrated ETF market limits what the flow data can establish. For the technical setup, holding $0.092 keeps the recovery structure intact, while a break below that level would bring lower support zones into view. A move above $0.102 would provide a clearer test of renewed upside momentum.
Sources & Methodology
Primary-source standard: Market-moving facts should link to original data releases, regulator notices, company filings or official project announcements whenever available. Secondary reporting is used for additional context, not as a substitute for original evidence.
Page last reviewed: