
Crude Oil WTI is trading around $89.24 on the five-hour chart, with the market caught between deeply oversold momentum and a broader bearish technical structure. The price is hovering just above the 200-period Simple Moving Average (SMA) at $89.13, while the lower Bollinger Band sits at $88.77.
The two indicators create an important support zone after the recent decline. At the same time, the Money Flow Index (MFI) has fallen to 14.98, a level that indicates heavily oversold conditions.
Oversold readings do not automatically signal a reversal. Instead, they show that selling pressure has become unusually strong relative to recent price action. For WTI, traders therefore face a conflict between stretched downside momentum and indicators that continue to point toward a bearish trend.
Bearish Trend Meets Oversold Momentum
The broader technical structure remains under pressure. The SuperTrend indicator remains bearish, with its stop level around $95.13, keeping the market below a significant trend barrier.
The Ichimoku Cloud also reinforces the bearish setup. Its lower boundary is near $92.41, while the upper boundary extends toward $97.11. WTI would need to reclaim this overhead region to materially improve the short-term technical picture.
The price is currently operating in a narrow area where neither side has established control. That makes confirmation particularly important rather than relying on the oversold MFI alone.
The main levels traders are monitoring include:
- $89.13: 200-period SMA and immediate support.
- $88.77: Lower Bollinger Band.
- $88.58: Key five-hour breakdown trigger.
- $86.89: Fibonacci support below the current range.
- $92.41-$97.11: Ichimoku Cloud resistance zone.
A five-hour close below $88.58 would weaken the current support structure and increase the risk of a move toward $86.89. Conversely, a recovery above the immediate resistance area could indicate that selling pressure is losing momentum.
Volatility Keeps Breakout Risk Elevated
WTI is also showing signs of heightened volatility. The Average True Range (ATR) stands at approximately 1.93, equivalent to about 2.15%, indicating that price swings remain substantial.
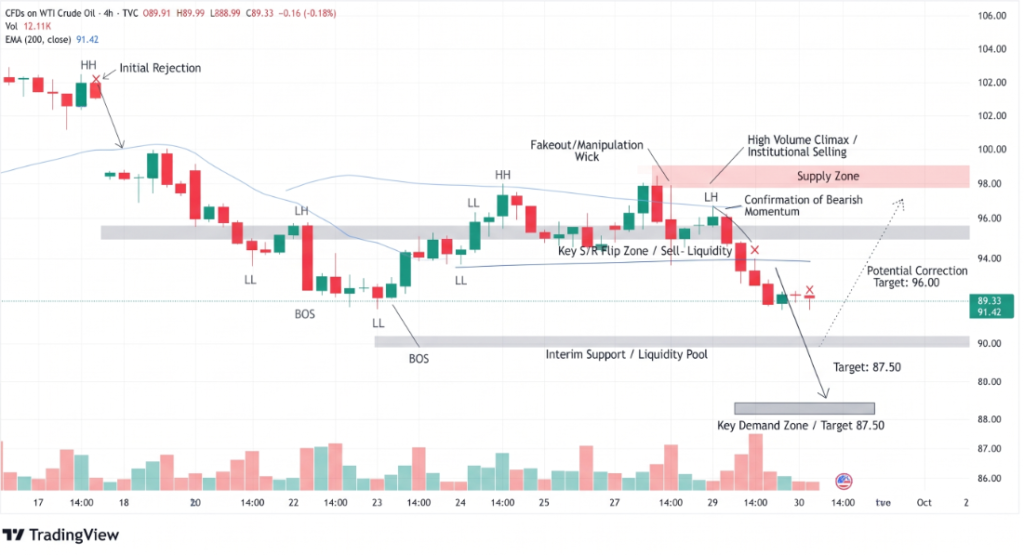
Price action between roughly $89.50 and $92.15 has created a narrow trading zone relative to the market’s broader volatility. A breakout from this range could therefore produce a larger move as traders respond to a confirmed change in momentum.
The chart also contains a completed double-top pattern near $106.75, a structure traditionally associated with a bearish reversal. However, after the subsequent decline, the remaining question is whether the pattern continues to generate downside momentum or whether sellers begin taking profits.
A doji candle near $89.56 adds to the uncertainty. The candle reflects a session in which buying and selling pressure ended relatively balanced, making the next confirmed move more significant.
Conclusion
WTI crude oil is caught between deeply oversold momentum and a persistent bearish trend. The $89.13 200-period SMA and $88.77 lower Bollinger Band provide the first major support zone, while $88.58 is the key breakdown level. A confirmed move below it could expose $86.89, while a recovery would first need to overcome resistance around $92.15-$92.41. With ATR near 2.15%, traders should expect potentially sharp moves once the current consolidation breaks.
Sources & Methodology
Primary-source standard: Market-moving facts should link to original data releases, regulator notices, company filings or official project announcements whenever available. Secondary reporting is used for additional context, not as a substitute for original evidence.
Page last reviewed: