
Cardano (ADA) remained under pressure on Monday, October 26, trading around $0.201 as weakening derivatives positioning and negative technical signals pointed to further downside risks. The token has suffered successive weekly declines since early October, while traders have become more cautious about the prospect of a recovery. Data from derivatives markets and on-chain analytics suggest sellers retain control, although oversold momentum could trigger temporary rebounds. For ADA, the key question is whether buyers can reclaim nearby resistance or whether the price will continue moving lower.
ADA Derivatives Signal Bearish Sentiment
According to CoinGlass derivatives data, Cardano’s long-to-short ratio stood at 0.70 on Monday, near its lowest reading in more than a month. A ratio below one indicates that short positioning outweighs long positioning under the metric’s methodology, reflecting a bearish bias among derivatives traders. The ratio measures positioning rather than guaranteeing that prices will fall.
The funding rate also turned negative, reaching -0.0032%. In perpetual futures markets, negative funding generally means short-position holders pay long-position holders. This can indicate bearish demand, although funding rates can change quickly as prices and positions shift.
On-chain signals add to the caution. CryptoQuant data cited in the market analysis points to large whale orders and overheated conditions in ADA futures, alongside selling dominance in spot and derivatives markets. These readings suggest that buying demand has struggled to absorb selling pressure.
Together, the indicators paint a weak near-term picture. However, derivatives positioning and on-chain metrics are evidence of current market conditions, not definitive predictors of future price movements.
Cardano Technical Levels to Watch
ADA trades below its 50-day, 100-day and 200-day exponential moving averages, clustered between approximately $0.218 and $0.237. These averages track recent price trends and can act as resistance when an asset trades beneath them.
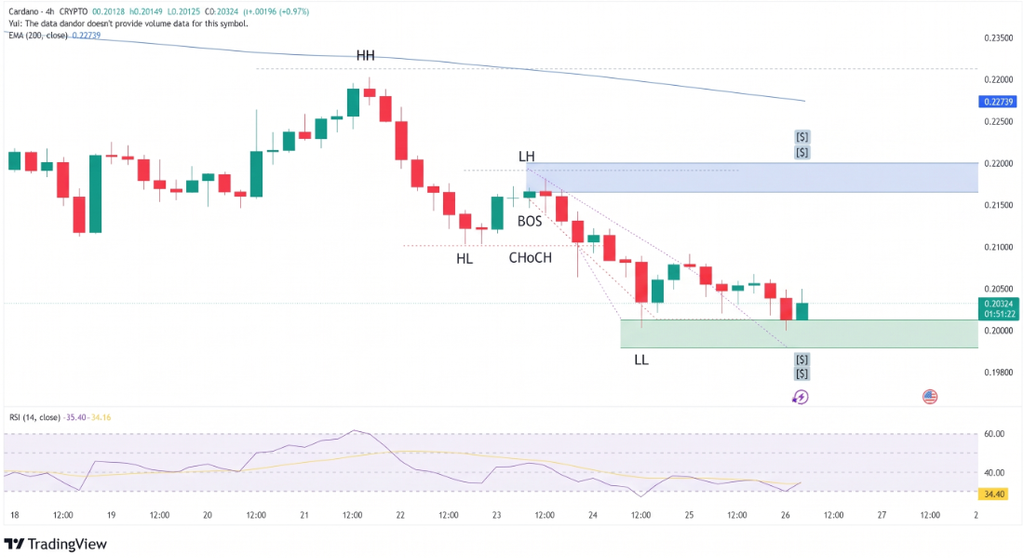
The failed break above a rising trendline near $0.213 has added another barrier for buyers. Meanwhile, the Relative Strength Index sits near 33, close to the commonly watched oversold threshold of 30. This signals weak momentum but leaves room for a short-lived rebound. The MACD indicator remains negative, with its line below the signal line, reinforcing the bearish trend.
Traders are watching these levels:
- $0.213: Initial resistance at the failed trendline break.
- $0.218–$0.237: Moving-average resistance zone.
- $0.245–$0.299: Higher resistance levels if recovery gains traction.
- $0.081: A much lower structural support reference identified in the supplied analysis.
A sustained move above $0.213 would be an early improvement, but ADA would need to clear the moving-average cluster to strengthen the recovery case.
Conclusion
Cardano’s immediate outlook remains bearish while price stays below key moving averages and derivatives sentiment remains weak. A decline below recent lows could deepen losses, although the RSI leaves open the possibility of a temporary bounce. A stronger reversal would require sustained buying, improving market positioning and a break above resistance. Until those conditions emerge, traders may treat rebounds cautiously and monitor price action around $0.213 and the $0.218–$0.237 resistance zone.
Sources & Methodology
Primary-source standard: Market-moving facts should link to original data releases, regulator notices, company filings or official project announcements whenever available. Secondary reporting is used for additional context, not as a substitute for original evidence.
Page last reviewed: