
Zcash (ZEC) traded near $1,200 on Monday, October 26, as fresh institutional demand struggled to reverse a broader monthly decline. The privacy-focused cryptocurrency has fallen more than 15% this month, according to the supplied market analysis, despite a strong rebound in investment flows into Grayscale’s Zcash exchange-traded fund. The fund attracted approximately $41.1 million in net inflows during the week ending October 23, its strongest weekly result since mid-September. However, ZEC still needs to reclaim important technical levels to establish a more convincing recovery.
Zcash ETF Inflows Signal Renewed Demand
Grayscale’s Zcash ETF, which trades under the ticker ZCSH, recorded four consecutive days of net inflows from October 20 through October 23, according to published ETF flow data. The turnaround followed three consecutive weeks of outflows, suggesting that some investors were returning to the asset despite uncertainty across cryptocurrency markets.
ETF inflows can indicate increased investor interest because a spot fund holds the underlying cryptocurrency. However, stronger fund demand does not guarantee an immediate increase in the token’s market price. Broader risk appetite, selling by existing holders and technical resistance can all affect price performance.
The renewed interest also comes ahead of Zcash’s planned Network Upgrade 7 (NU7), expected around November 5. According to CoinDesk’s upgrade report, the upgrade is designed to reduce block intervals from 75 seconds to 25 seconds and disable the original Sprout privacy system. The activation timing and implementation remain important developments for users and investors to monitor.
ZEC Technical Levels Define the Outlook
ZEC remains under short-term pressure on the four-hour chart, trading below its 50-period and 200-period exponential moving averages, positioned near $1,207 and $1,231, respectively, in the supplied analysis. These indicators track recent prices and can help traders assess momentum and potential resistance.
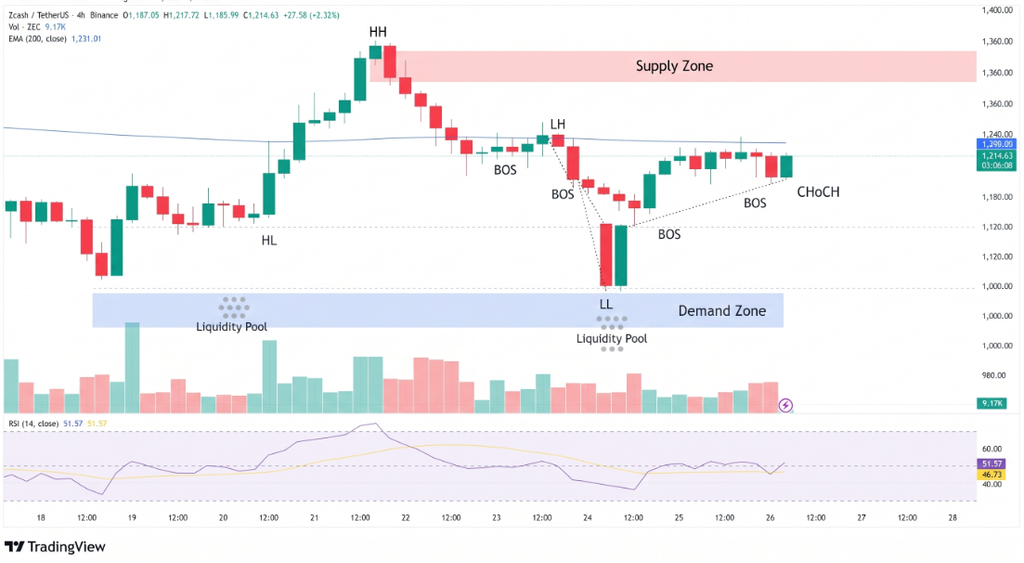
The Relative Strength Index (RSI) near 47 suggests relatively neutral momentum, while the Moving Average Convergence Divergence (MACD) indicator remains slightly positive near the zero line. Neither signal alone confirms a bullish reversal.
Key levels for traders include:
- $1,231: 200-period EMA resistance.
- $1,268: Previous weekly price peak identified in the source analysis.
- $1,368: Recent high that ZEC needs to exceed to strengthen the recovery case.
- $1,050–$1,000: Support zone near the September 4 high and the psychological $1,000 threshold.
Above $1,268, a sustained move through $1,368 could improve the technical outlook. Failure to reclaim resistance would leave the token vulnerable to renewed selling.
Conclusion
Zcash’s outlook depends on whether institutional demand can translate into sustained buying in the market. The $41.1 million weekly inflow is encouraging, but ZEC remains below key moving averages and well under its September peak of $1,698. A break above $1,368 would strengthen the recovery scenario, while a decline toward $1,050 could expose the $1,000 level. Traders should watch ETF flows, NU7 implementation updates and price action around resistance before treating the rebound as a confirmed trend change.
Sources & Methodology
Primary-source standard: Market-moving facts should link to original data releases, regulator notices, company filings or official project announcements whenever available. Secondary reporting is used for additional context, not as a substitute for original evidence.
Page last reviewed: