
Cardano (ADA) extended its decline on Tuesday, trading near $0.188 after losing the important $0.190 support area in the previous session. Weak derivatives positioning, cautious on-chain activity and deteriorating technical indicators are keeping buyers on the defensive. Although funding rates have turned positive, the broader market signals remain mixed. ADA is trading below its major moving averages, leaving the token exposed to further losses unless buyers regain control of the market.
Derivatives data signals bearish positioning
Data from CoinGlass showed Cardano’s long-to-short ratio at 0.75 on Tuesday, close to its lowest reading in more than a month. A ratio below one indicates that short positions outweigh long positions in the measured accounts, suggesting traders are increasingly positioned for lower prices.
However, the derivatives picture is not entirely negative. ADA’s funding rate turned positive, reaching 0.0071% on Tuesday. In perpetual futures markets, positive funding generally means traders holding long positions pay those holding short positions. This indicates that some bullish exposure remains despite the broader weakness.
The contrast between the two indicators suggests that traders are divided over Cardano’s near-term direction. Positive funding alone, however, does not confirm a reversal, particularly while the token continues to trade below major technical resistance.
On-chain indicators reinforce selling pressure
Data from CryptoQuant points to cautious conditions across Cardano’s spot and futures markets. Large whale orders, signs of overheated activity and sell-side dominance indicate that larger transactions are occurring alongside persistent selling pressure.
Whale activity can influence market liquidity and short-term price movements because large holders can move substantial quantities of tokens. However, the presence of large orders does not automatically establish whether investors are accumulating or distributing ADA. The broader sell-side dominance remains the more concerning signal for buyers.
Together, the derivatives and on-chain readings suggest that confidence in a sustained recovery remains limited. Traders will need stronger buying activity and improving market momentum before the bearish outlook begins to weaken.
ADA forecast: $0.155 support in focus
Cardano’s technical structure remains bearish, with its price near $0.188 and well below the 50-day and 100-day Exponential Moving Averages (EMAs) at $0.216 and $0.215, respectively. The former rising support trendline around $0.218 has also turned into resistance, reinforcing the overhead supply zone.
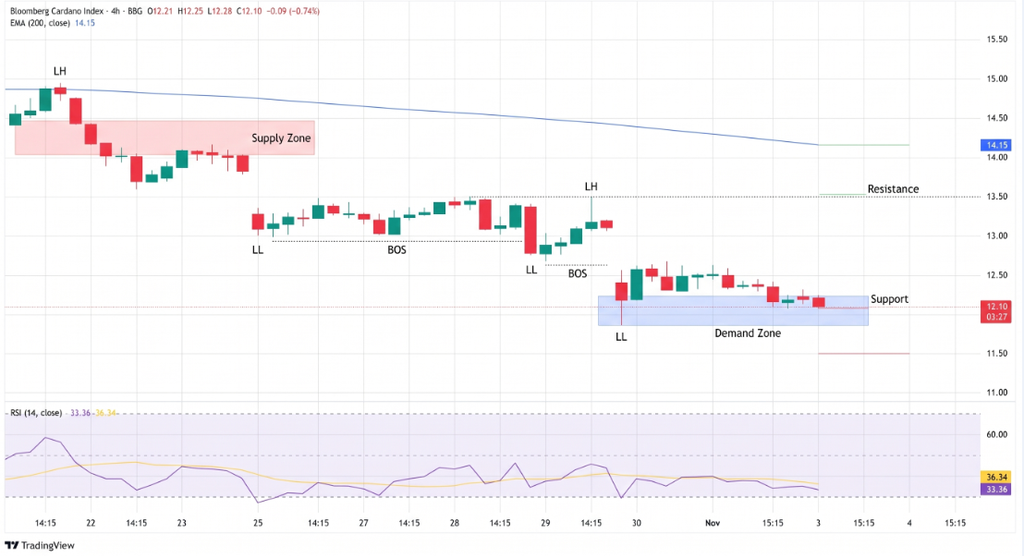
The Relative Strength Index (RSI) is approaching 30, indicating that selling momentum is nearing traditionally oversold territory. Meanwhile, the Moving Average Convergence Divergence (MACD) remains slightly negative, showing that downward pressure has not yet disappeared.
Key levels traders are monitoring include:
- $0.215–$0.218: Initial resistance and the former trendline.
- $0.236–$0.239: Higher resistance, including the 200-day EMA.
- $0.245 and $0.299: Additional upside barriers.
- $0.155: Major downside support if selling accelerates.
Conclusion
Cardano remains vulnerable as bearish positioning and weak technical momentum outweigh the limited support from positive funding rates. A sustained recovery above $0.218 would be an important first step toward improving the outlook, while a move below $0.155 could expose ADA to a deeper correction. Until buyers reclaim the moving-average resistance zone, the balance of risk remains tilted toward further downside.
Sources & Methodology
Primary-source standard: Market-moving facts should link to original data releases, regulator notices, company filings or official project announcements whenever available. Secondary reporting is used for additional context, not as a substitute for original evidence.
Page last reviewed: