Cardano’s ADA token remains under pressure, trading around $0.168 on Friday as persistent selling threatens to extend its weekly losing streak to six weeks. The decline has erased more than 30% of its value since early October, while derivatives positioning and on-chain activity point to weakening market confidence. With ADA trading below major moving averages and momentum indicators remaining negative, traders are watching the $0.156 support level for signs of whether the correction could deepen.
Derivatives data signals bearish sentiment
Cardano’s derivatives market is showing signs of growing caution. According to CoinGlass, ADA’s long-to-short ratio stood at 0.86 on Monday, approaching its lowest reading in more than a month. A ratio below 1 indicates that short positions outnumber long positions within the measured dataset, suggesting a bearish positioning bias among traders.
Funding rates have added to the negative picture. The rate reportedly turned negative on Thursday and reached -0.0015% on Friday. In perpetual futures markets, negative funding generally means traders holding short positions pay those holding longs. This can indicate stronger demand for bearish exposure, although funding rates alone do not establish the direction of future prices.
The combination of weak positioning and negative funding suggests that traders are becoming less confident in a near-term recovery. However, crowded short positions can also increase the possibility of a short squeeze if prices unexpectedly rebound.
On-chain activity points to caution
On-chain indicators provide another warning about Cardano’s market conditions. Data from CryptoQuant highlights large whale orders in both spot and futures markets, alongside elevated trading conditions and sell-side dominance.
These readings suggest that larger transactions are occurring while selling pressure remains influential. They do not, by themselves, establish whether individual large holders are accumulating or distributing ADA. Nevertheless, persistent sell-side activity can make it harder for prices to recover, particularly when derivatives traders are also positioned defensively.
Several broader indicators reinforce the cautious outlook:
- Long-to-short ratio: 0.86, indicating a bearish positioning bias.
- Funding rate: -0.0015% in Friday’s reported snapshot.
- Market participation: Derivatives and on-chain signals point to subdued confidence.
Together, these metrics suggest that buyers have yet to establish convincing control.
ADA technical outlook: $0.156 in focus
ADA traded near $0.168 in the supplied Friday market snapshot, remaining well below its 50-day, 100-day and 200-day exponential moving averages at $0.203, $0.208 and $0.229, respectively. This alignment indicates that the broader trend remains bearish.
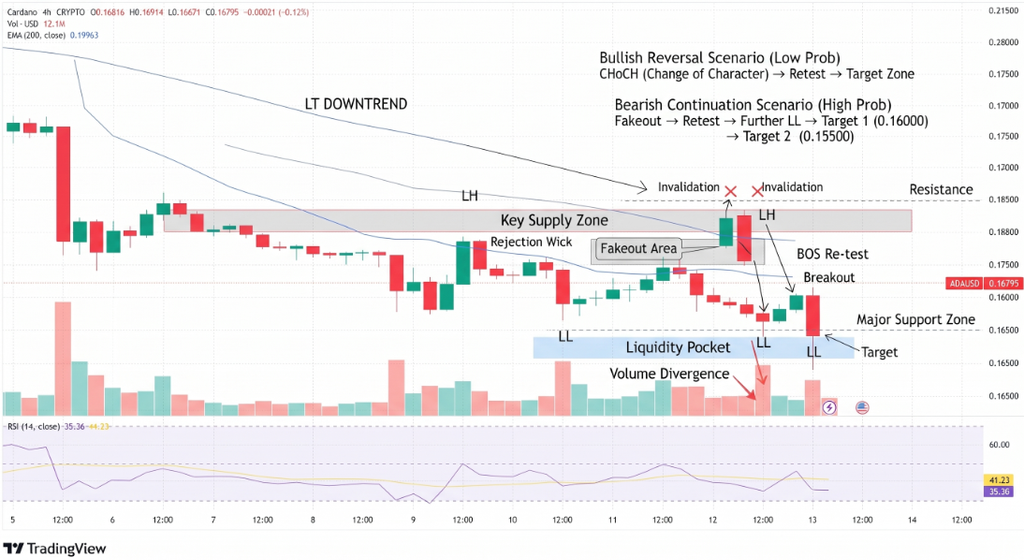
The Relative Strength Index (RSI) was near 28, placing it below the conventional 30 threshold for oversold conditions. While this reflects intense selling momentum, an oversold reading does not guarantee an immediate rebound. The MACD also remained negative, with a flat histogram indicating that bearish momentum had yet to show a clear reversal.
On the downside, $0.156 is the next important support. A sustained break below it could expose ADA to further losses. On the recovery side, resistance begins around $0.183, followed by the moving-average zone between $0.203 and $0.229. Additional barriers stand at $0.236, $0.245 and $0.296.
Conclusion
Cardano’s outlook remains tilted to the downside as weak derivatives positioning, cautious on-chain signals and bearish technical indicators converge. A break below $0.156 would strengthen the case for another leg lower, while a sustained move above $0.183 would offer an early sign that selling pressure is easing. Until buyers reclaim key resistance levels, the broader recovery remains uncertain.
Sources & Methodology
Primary-source standard: Market-moving facts should link to original data releases, regulator notices, company filings or official project announcements whenever available. Secondary reporting is used for additional context, not as a substitute for original evidence.
Page last reviewed: