
Chainlink (LINK) traded above $13 on Monday, extending its recovery from Thursday’s low of $12.09 as institutional investment and large-wallet accumulation strengthened the market outlook. Data showed that Chainlink-focused exchange-traded funds (ETFs) attracted $9.48 million on Friday, their largest daily inflow of the year, while whale holdings increased. Technically, LINK is testing resistance near $13.50 after rebounding from a rising support trendline. A confirmed breakout could open the way toward $13.93 and potentially the September high of $15.77, although failure to clear resistance could trigger another pullback.
ETF Inflows and Whales Support LINK
Institutional demand for LINK has improved, with Chainlink-focused ETFs recording five consecutive weeks of net inflows, according to the supplied SoSoValue data. The $9.48 million inflow reported for Friday suggests renewed interest from investors seeking exposure to the cryptocurrency through regulated investment products.
Sustained ETF inflows can provide additional demand, although daily flows do not guarantee continued buying or an immediate price increase. Investors will need to monitor whether inflows persist as LINK approaches resistance.
On-chain indicators also point to increased accumulation among large holders. According to Santiment, wallets holding between 1 million and 100 million LINK accounted for 65.6% of circulating supply, up from 65.38% on October 1. This represents an increase of 0.22 percentage points.
Large-wallet accumulation may reduce the amount of LINK readily available for trading if tokens are held for extended periods. However, whale balances alone cannot establish future price direction, as large holders can also sell into rallies.
LINK Tests $13.50 Breakout Resistance
LINK traded around $13.34 in Monday’s technical assessment, recovering from support near $12.30. This rising trendline connects the August 10 and September 16 lows, while the September 29 peak of $15.77 remains a significant reference point for the broader recovery.
The token is testing a declining resistance trendline near $13.50, drawn from the September 30 and October 5 highs. A sustained break above this barrier would strengthen the bullish case and place the 50% Fibonacci retracement at $13.93 in focus. Further gains could bring $15.77 into view, followed by the 127.2% Fibonacci extension near $16.77.
Momentum indicators are supportive. The four-hour Relative Strength Index (RSI) is around 57, above the neutral 50 threshold, while the Moving Average Convergence Divergence (MACD) remains positive. Together, these signals indicate improving momentum, although a breakout still requires confirmation.
Chainlink Price Forecast: Key Levels
The immediate outlook depends on whether buyers can push LINK above $13.50 while defending nearby moving-average support.
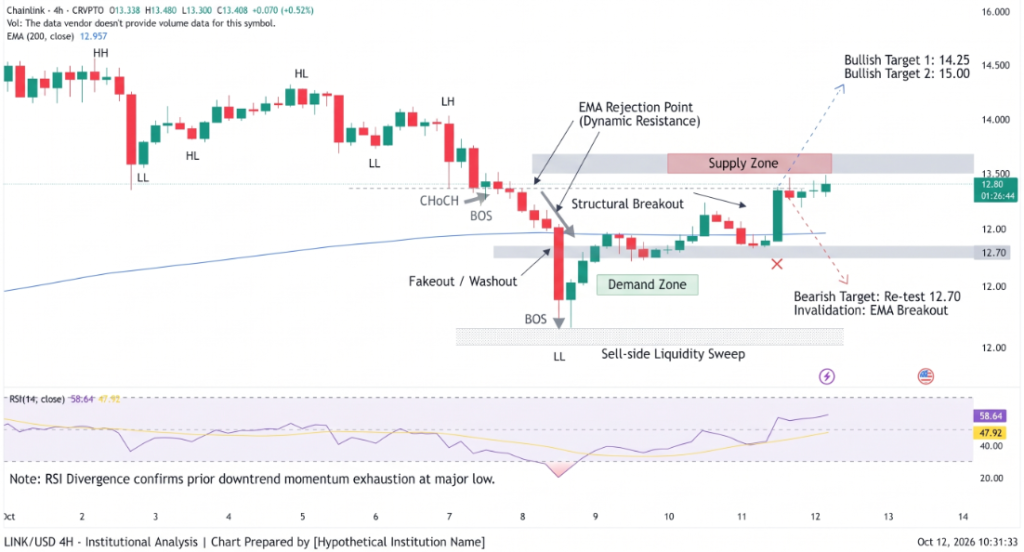
Key levels to watch include:
- $13.50: Immediate trendline resistance and breakout trigger.
- $13.93: 50% Fibonacci retracement target.
- $15.77: September swing high and major upside hurdle.
- $16.77: Potential extension target after a sustained breakout.
- $13.32 and $12.95: 50-period and 200-period EMA support.
- $12.30 and $12.09: Deeper structural support levels.
Conclusion
Chainlink’s recovery is supported by reported ETF inflows, rising whale holdings and improving four-hour momentum. However, the $13.50 resistance zone remains the key test. A confirmed breakout could extend the advance toward $13.93 and $15.77, while rejection could send LINK back toward $12.95 or the $12.30 trendline area. Until resistance gives way, the bullish outlook remains conditional rather than confirmed.
Sources & Methodology
Primary-source standard: Market-moving facts should link to original data releases, regulator notices, company filings or official project announcements whenever available. Secondary reporting is used for additional context, not as a substitute for original evidence.
Page last reviewed: